Illustrated · 3 min

Nuclear Magnetic Resonance (NMR) is a family of analytical techniques used to determine molecular structure. The most common form of NMR is proton NMR, or H-NMR. In this method the relative positions of protons are examined, and used to deduce the structure of the molecule. This document will focus only on H-NMR.
How It Works
Protons are a spinning charged particle, thus they produce a magnetic field. When introduced to an external magnetic field, the proton field takes either an up spin (parallel with external field) or a down spin (anti-parallel with external field).
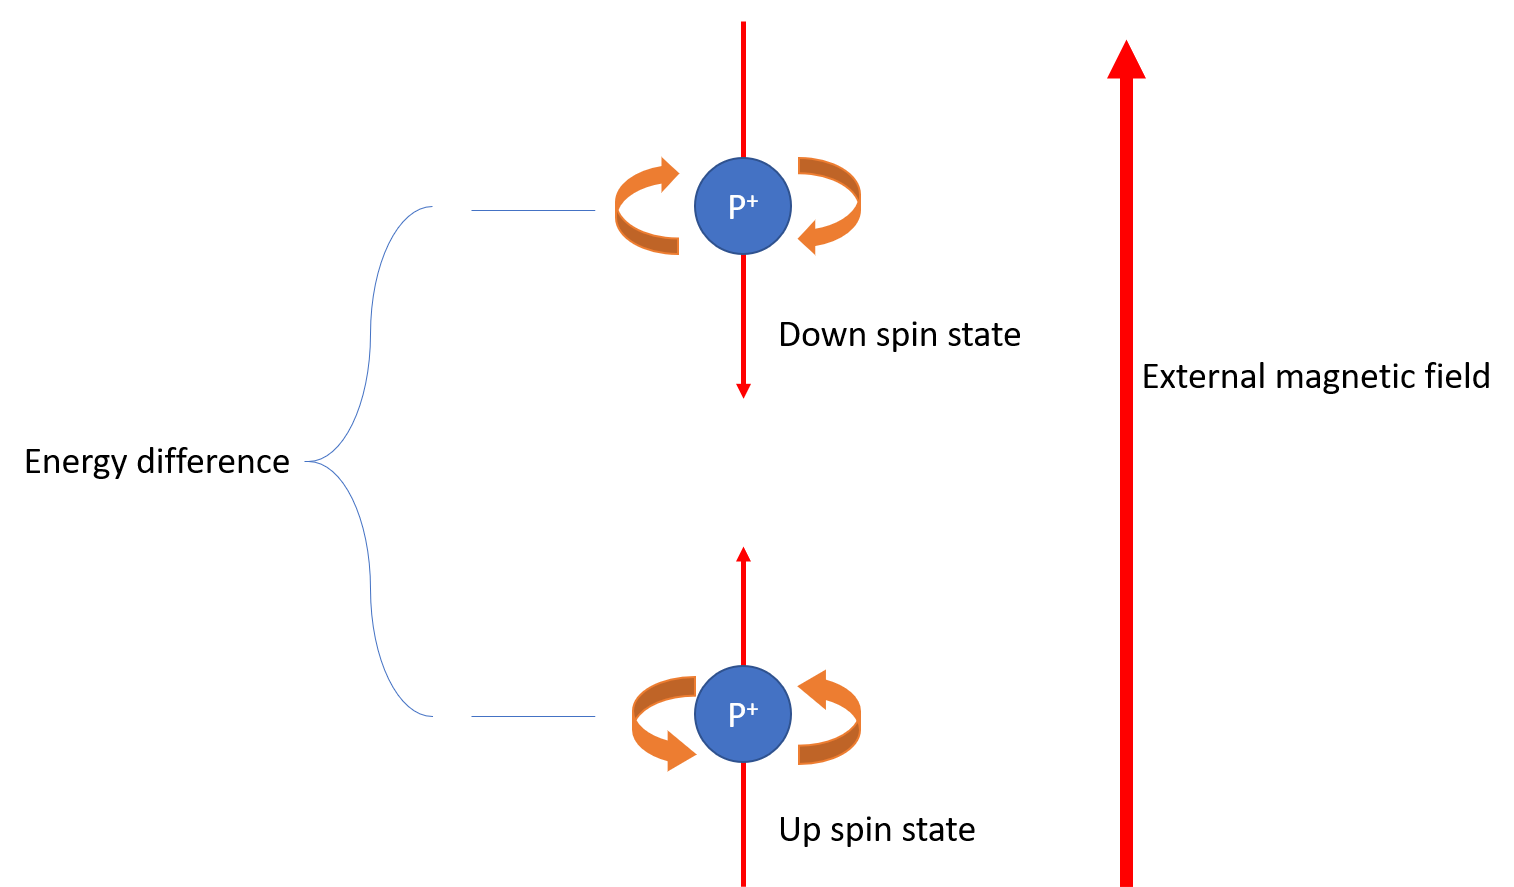
Image by Jasper Brown
The energy difference between these two states is well characterized and dependent on the strength of the magnetic field. The energy which the external field imparts on to the system is dependent on the frequency of the field. When the energy of the field is the same as the energy difference between the up and down states, the proton will rapidly flip between the two states, and gives off slight electromagnetic radiation. A proton NMR detects this radiation, and records its strength.
You may be thinking to yourself, "How are we able to distinguish protons if their resonant frequency is only dependent on the external field?" This is a valid concern. Luckily for us, molecules are imperfect systems. The magnetic fields become shielded by electrons, and thus very slightly different field strengths are required for the resonance of different protons. In order to determine the structure of a molecule, an NMR spectrometer uses a constant frequency and slightly changes the field strength in order to collect all the signal.
Interpreting Data: Chemical Shifts
Data from an NMR spectrometer is often given in relative integration versus parts per million (ppm). Relative integration is a measure of how many protons are reacting to the particular signal being placed. The exact number of protons cannot be determined in the general case since the molecule may have symmetry. Usually the largest peak is set to a value of 1. The field strength, or chemical shift, is typically transformed to be expressed in ppm. This is done in order to make the data more palatable. Signals generally range from 0 to 12 ppm. A chart of typical shifts and their correlated structure is shown below.
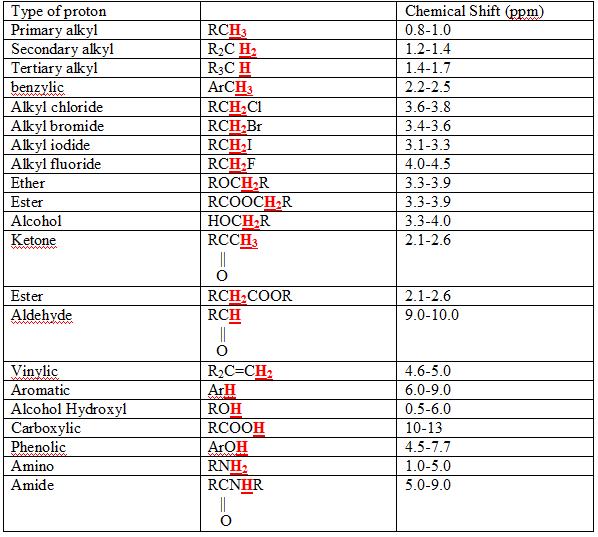
Image source: By Kcwang CC BY 2.0, via Wikimedia Commons

Interpreting Data: Splitting
Protons nearby to each other have slight magnetic effects on each other. This gives rise to an interesting phenomenon called splitting. Splitting is incredibly important diagnostic data obtained from an NMR. Splitting refers to how many peaks a proton, or group of protons creates. It is dependent on the number of protons that adjacent carbons have. As a general rule, the split pattern is the number of protons on adjacent carbons plus 1. Let's look at chloroethane as an example.
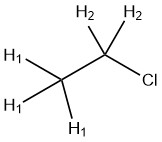
Image courtesy of ChemDraw
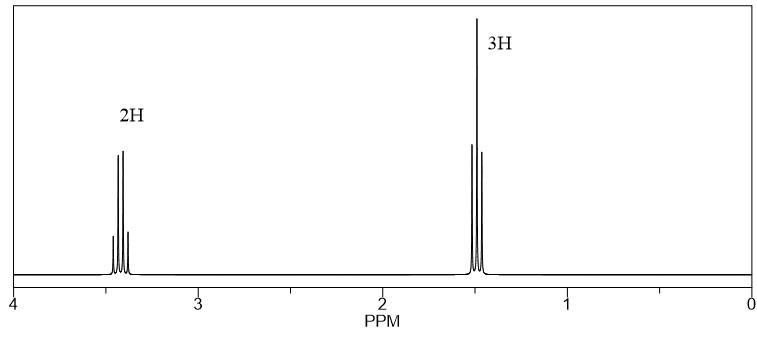
is a set of three primary alkyl protons. This means that they will show up around 1 ppm. Since the adjacent carbon has 2 protons on it, the protons will split in to a triplet. The protons are 2 alkyl chloride protons, so it will appear around 3.7 ppm. Since the adjacent carbon has 3 protons, the will split into a quartet. In summary, we predict a quartet integrating to 2 protons around 3.7 ppm, and a triplet integrating to 3 protons around 1 ppm. A predicted NMR of chloroethane generated by ChemDraw is shown below.