Pedigree — Definition & Charts

Illustrated · 2 min

Elements of a Pedigree

A pedigree is a diagram used to observe inheritance patterns in an existing population. The term comes from an Anglo-French phrase meaning "crane foot". It was probably called this because the branching lines of the chart look like the foot of a crane. This type of analysis is very helpful when controlled crosses are difficult, time-consuming, or unethical.

This branching diagram typically starts with two parents at the top and moves down with the following generations.

A pedigree diagram. A female with a certain trait has children with a male who doesn't have the trait. Their children are an affected male, unaffected female, and a male who does not have the trait but carries an allele for it. The affected son has a child with an unaffected female. The child is an affected female.

Image source: By Gabi Slizewska

Usually, the squares represent males and circles represent females. The diagram above is also color coded so that purple individuals have the trait or disease that is being studied. Sometimes the symbol will be half colored. This means that the individual doesn't have the trait but carries an allele for it.

The relationships between people are shown below.

A pedigree showing that a horizontal line connecting two people signifies mating. The line coming down from these two people shows the couple's children.

Image source: By Gabi Slizewska

Pedigree Analysis

There are four main inheritance patterns that can be predicted using a pedigree:

1. Autosomal dominant

2. Autosomal recessive

3. X-linked dominant

4. X-linked recessive

An autosomal trait is found on any chromosome other than the sex chromosomes (X or Y). On the other hand, a sex-linked trait is controlled by genes found only on either the X or Y chromosome. Typically, we only talk about traits on the X chromosome (X-linked) because it contains far more genes than the Y chromosome does. Using a pedigree, we can also find out if a trait is dominant or recessive.

The first step to analyzing a pedigree is to see who is affected. If both males and females are (about) equally affected by a trait, then it is most likely an autosomal trait. If the trait is seen mostly in males or mostly in females, then it is probably X-linked. Y-linked traits can only affect males.
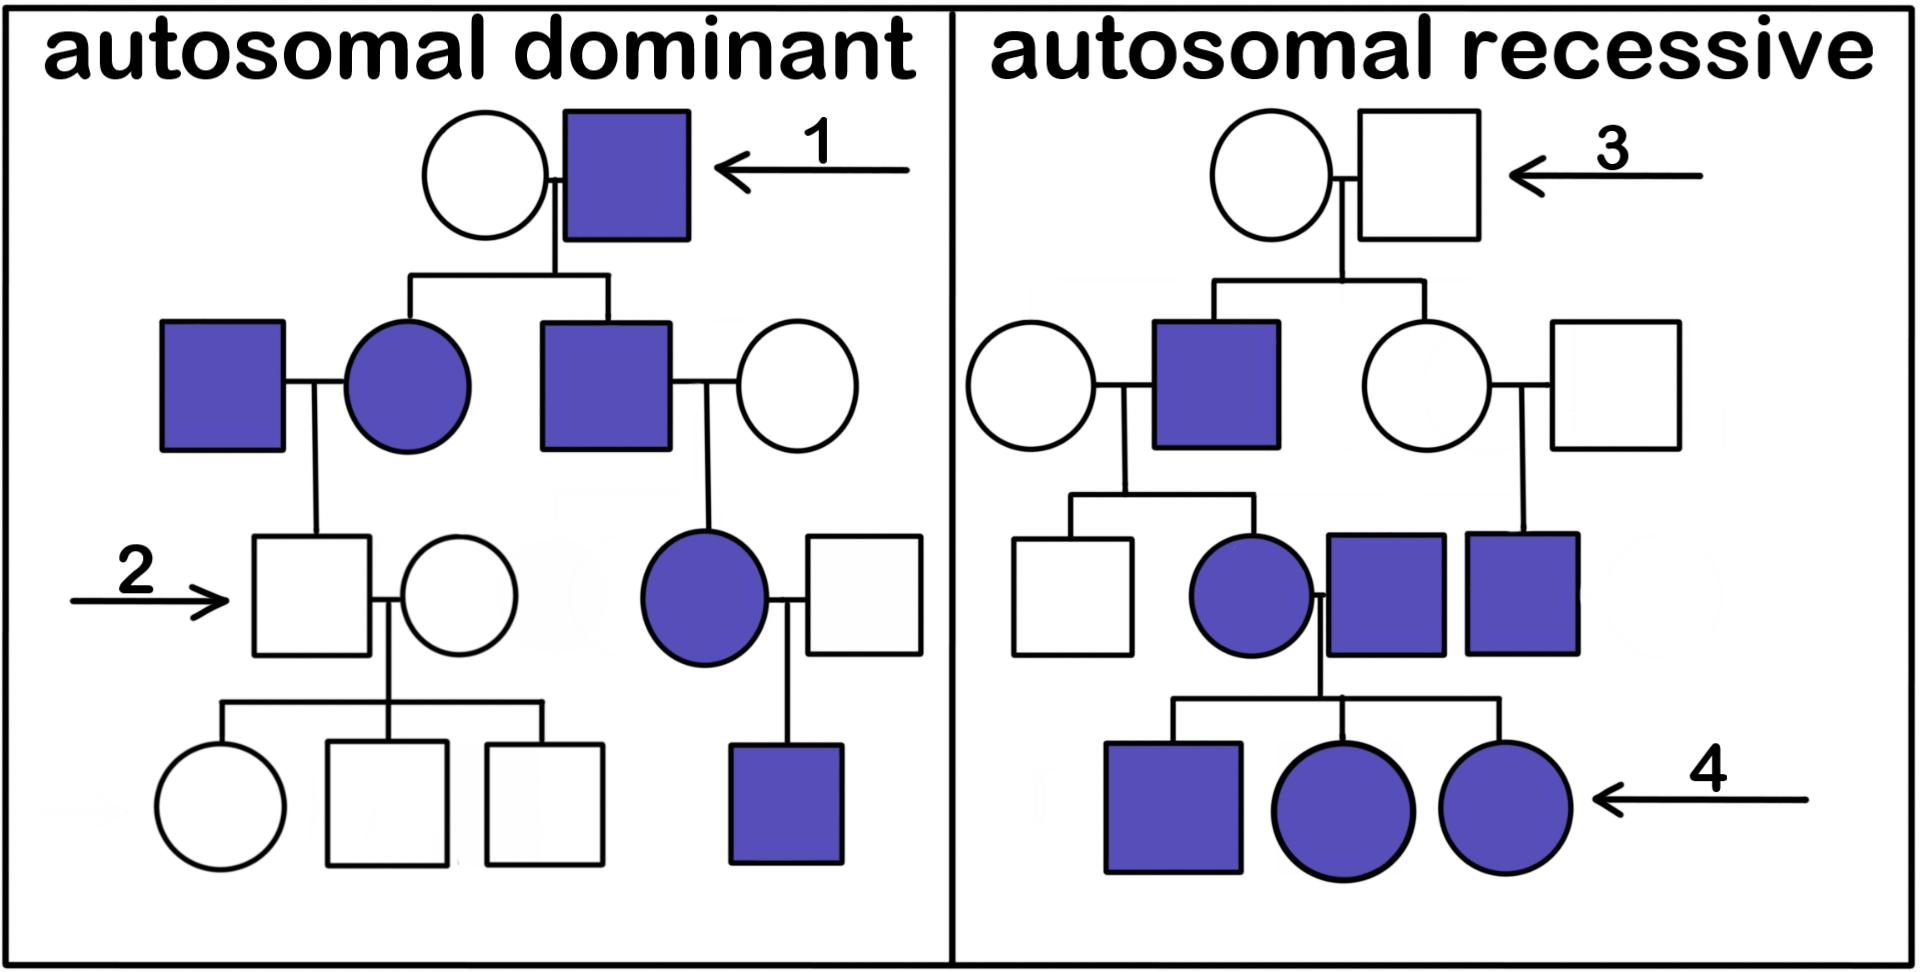
An autosomal-dominant pedigree. There is one affected parent and one unaffected parent. This couple has two affected children. One of those children has an unaffected child who then has kids with another unaffected person. All their kids are unaffected. The other child of the original parents has an affected child with an unaffected person. The child has an affected child with an unaffected person. An autosomal-recessive pedigree starts with unaffected parents who have one affected and one unaffected child. The affected child has children with an unaffected person. Among their children, one is affected and one is unaffected. The affected child has a child with another affected person. All their children are affected. The unaffected child of the first couple has children with another unaffected person. This couple has an affected child.

On the left is a pedigree for an autosomal dominant trait, and on the right is a pedigree for an autosomal recessive trait. The arrows show key points that can help you distinguish between these two inheritance patterns when looking at a pedigree diagram. Read on to see how.

Image source: By Gabi Slizewska

Autosomal Dominant:

  • Affected children must have at least one affected parent (arrow 1 in the diagram above)
  • Two affected parents can have an unaffected child (arrow 2)

Autosomal Recessive:

  • Parents don't have to be affected, but both must at least be carriers (heterozygous for the trait) (arrow 3)
  • Two affected parents will only have affected children (arrow 4)
  • This trait often skips generations
  • The trait will also appear more often in children of related parents (consanguine, also known as incest)
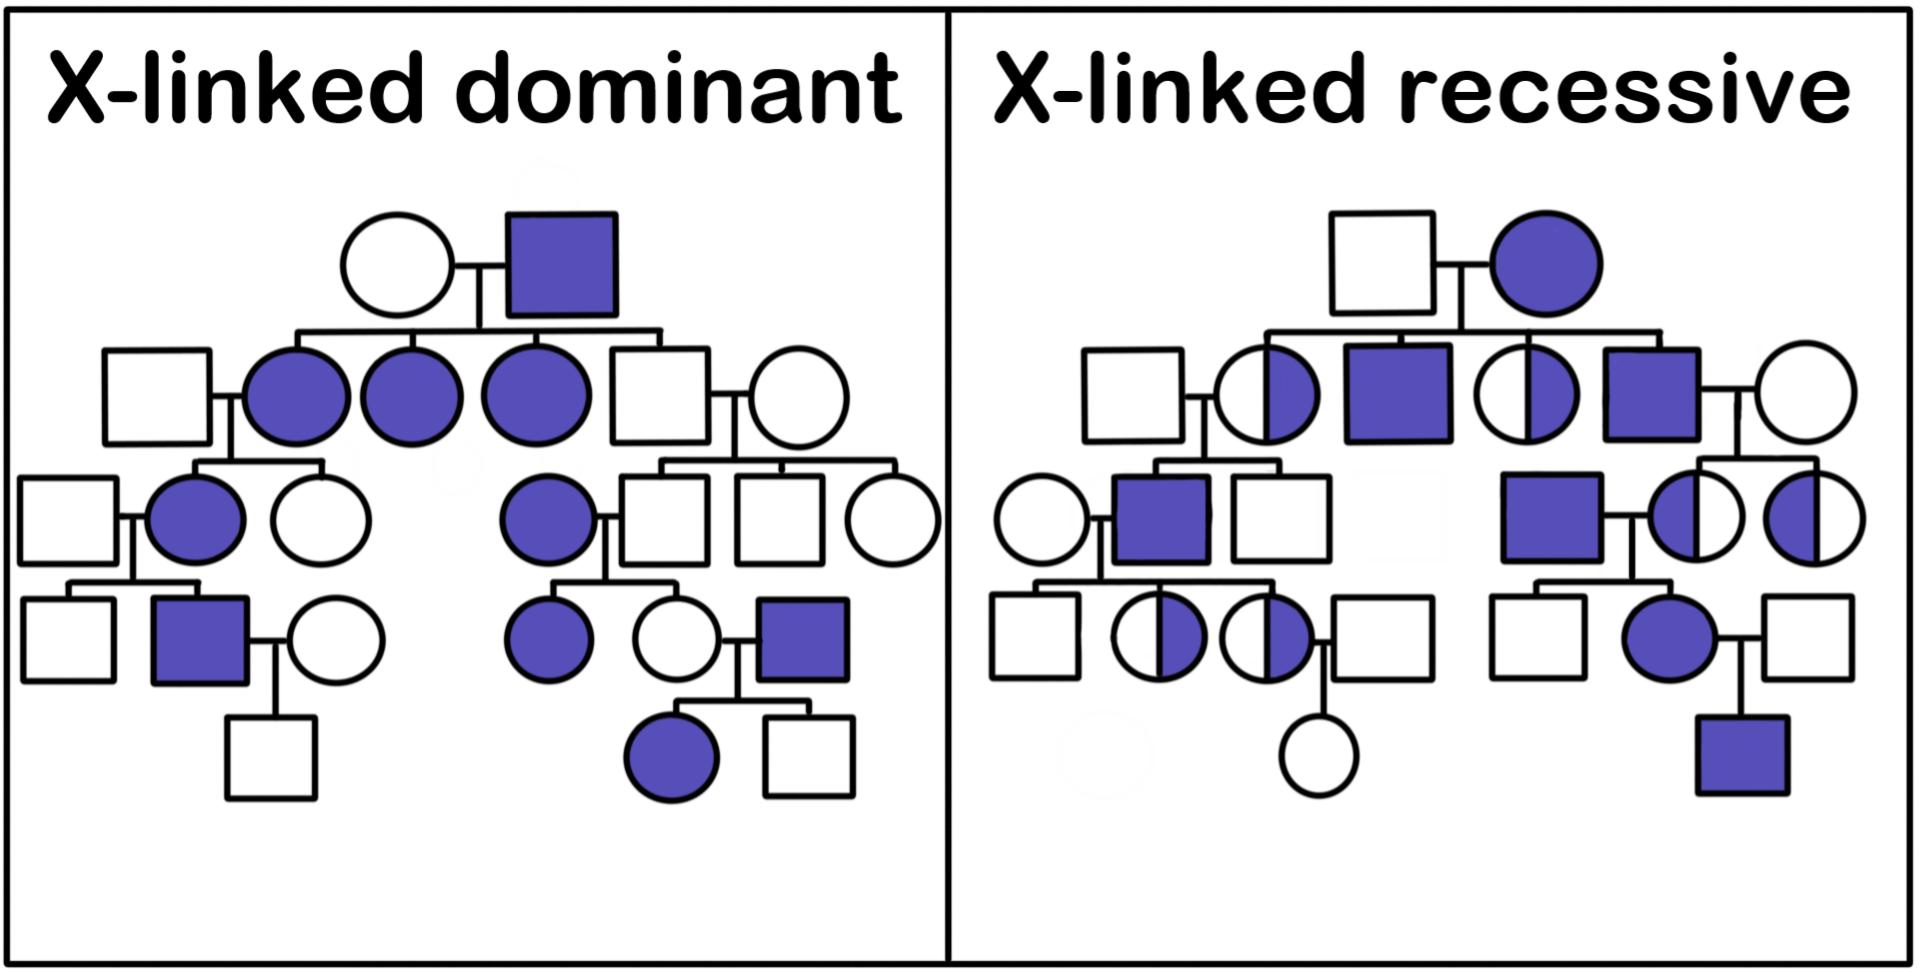
A pedigree for an X-linked dominant trait. An affected father and unaffected mother have three affected daughters and one unaffected son. One of the affected daughters has two kids with an unaffected man. The kids are one affected daughter and one unaffected daughter. The affected girl has one affected son and one unaffected son with an unaffected man. The affected child has an unaffected son with an unaffected woman. The unaffected son of the original couple has two unaffected sons and one unaffected daughter with an unaffected woman. One of the unaffected sons has children with an affected woman. The kids are one affected daughter and one unaffected daughter. The unaffected daughter has one affected daughter and one unaffected son with an affected man. In an X-linked recessive pedigree, an unaffected man has kids with an affected woman. They have two affected sons and two daughters who are not affected but carry the gene for the trait. One of the daughters has one affected son and one unaffected son with an unaffected man. The affected son has children with an unaffected woman. Their kids are one unaffected son and two unaffected daughters who are carriers. One of those daughters has an unaffected daughter with an unaffected man. One of the affected sons from the original couple has children with an unaffected woman. They have two daughters who are unaffected but carry the gene. One of those daughters has kids with an affected man. They have an unaffected son and an affected daughter. The daughter has one affected son with an unaffected man.

Image source: By Gabi Slizewska

X-Linked Dominant:

  • Both sexes are affected, but typically seen more in females
  • An affected son must have an affected mother
  • Affected males will pass on the trait to all of their daughters

X-Linked Recessive:

  • Both sexes are affected, but seen in males more frequently
  • Affected mothers will pass on the trait to all of their sons
  • The trait sometimes skips a generation

Illustrated · 2 min

What Do Pedigrees Show Us?

A pedigree chart is a diagram that shows the relationships between individuals in a family. Pedigrees are used to determine inheritance patterns for traits. Scientists can deduce inheritance patterns for rare diseases by analyzing the pedigree chart of an existing population.

An example of a pedigree chart at work:

This is an illustration showing a lumpy cartoon family. There is a mother and father with four children. The whole family is purple except one of the children, who is pink.

Image source: By Sylvia Freeman

Have a look at this happy, lumpy family. All of them have five lumps and, except for the middle child, all of them are purple. Although the lumpy parents love all of their children, sometimes they can't help but wonder if their pink son is really theirs or if he was accidentally switched with another lumpy baby at the hospital.

One day, they decide to go to a genetic counselor to see how this could have happened. The counselor knows that the trait for pink color is recessive to purple, so she asks some questions about their family history. Then, from that information she creates a pedigree chart with our lumpy family in the bottom left:

This is an illustration of a pedigree chart for a family of cartoon lumpy people. A pedigree chart shows the relationships between people. In the first generation, there are two parents. They have two daughters and a son. The daughter marries and has two daughters and two sons. One son marries and has two sons, while one son has no children.

In a pedigree chart, squares symbolize males and circles symbolize females. Lines between two individuals represent marriage, and lines descending from a couple represents their children. \\ Image source: By Sylvia Freeman

Going backwards on the pedigree chart, we can see that the pink son's grandfather was also pink. The genetic counselor decides that the lumpy mother must have inherited a recessive pink allele from her father. After learning that one of the lumpy father's parents is also pink, she says with confidence that because both parents are heterozygous for the color trait, the pink son is indeed theirs.

In this case you observed how a pedigree chart can be used to determine relatedness for an autosomal recessive trait.

You may say, "That's silly. Why would I need a graph to show me who my family is? I know who I'm related to." If you have a smaller family, you're probably right. But imagine that you have a huge extended family. There's so many cousins, second cousins, uncles, aunties, and in-laws that you haven't even met most of them, let alone managed to keep track of their names.

Now, imagine having a family reunion with that huge extended family:

This is a cartoon illustration to help explain what a pedigree is. The image shows a large group of pink and purple lumpy people posing in a family photo.

Family photo

Image source: By Sylvia Freeman

It'd be pretty nice to have a family tree diagram labeled with who's who and how everyone is related, right? Especially if you find out that some of your family members have a rare recessive trait, you can create a pedigree chart of everyone to find out the likelihood that you are a carrier for the trait.

Video

(Video) Pedigrees

by Amoeba Sisters

A pedigree is kind of like a family tree but for showing genotypes. This video by Amoeba Sisters will teach you how to read and write pedigrees by using the example of an autosomal recessive trait: attached earlobes.

Type a concept, like “slope” or “photosynthesis”.

↑ ↓ to choose · Enter to openSearch explanations and problems