Let's imagine one mole of the noble gas argon. We'll place it in a large container. Let's say our container is 100.0 liters. We'll assume we're at standard temperature and pressure. So, we know the volume of our gas should be 22.4 liters. But, gases fill their containers. So, it has plenty of room. Under these conditions, the kinetic molecular theory is accurate. The atoms have negligible volume. More so, they experience minimal dispersion forces. We would expect ideal gas behavior.
Now, let's start to shrink our container. At first, it doesn't matter. At 75.0 or 50.0 liters, argon still has plenty of space. But, what happens when we get to 20.0 liters or less. Now, the atoms have less space than usual. Their volume becomes significant. More importantly, the dispersion forces become a factor. So, it begins to behave like a real gas.
As we continue to shrink our container, the argon atoms are colliding more. So, our pressure is rising. Let's assume we've been able to keep the temperature the same. What will happen? The pressure will cause the gas to condense.
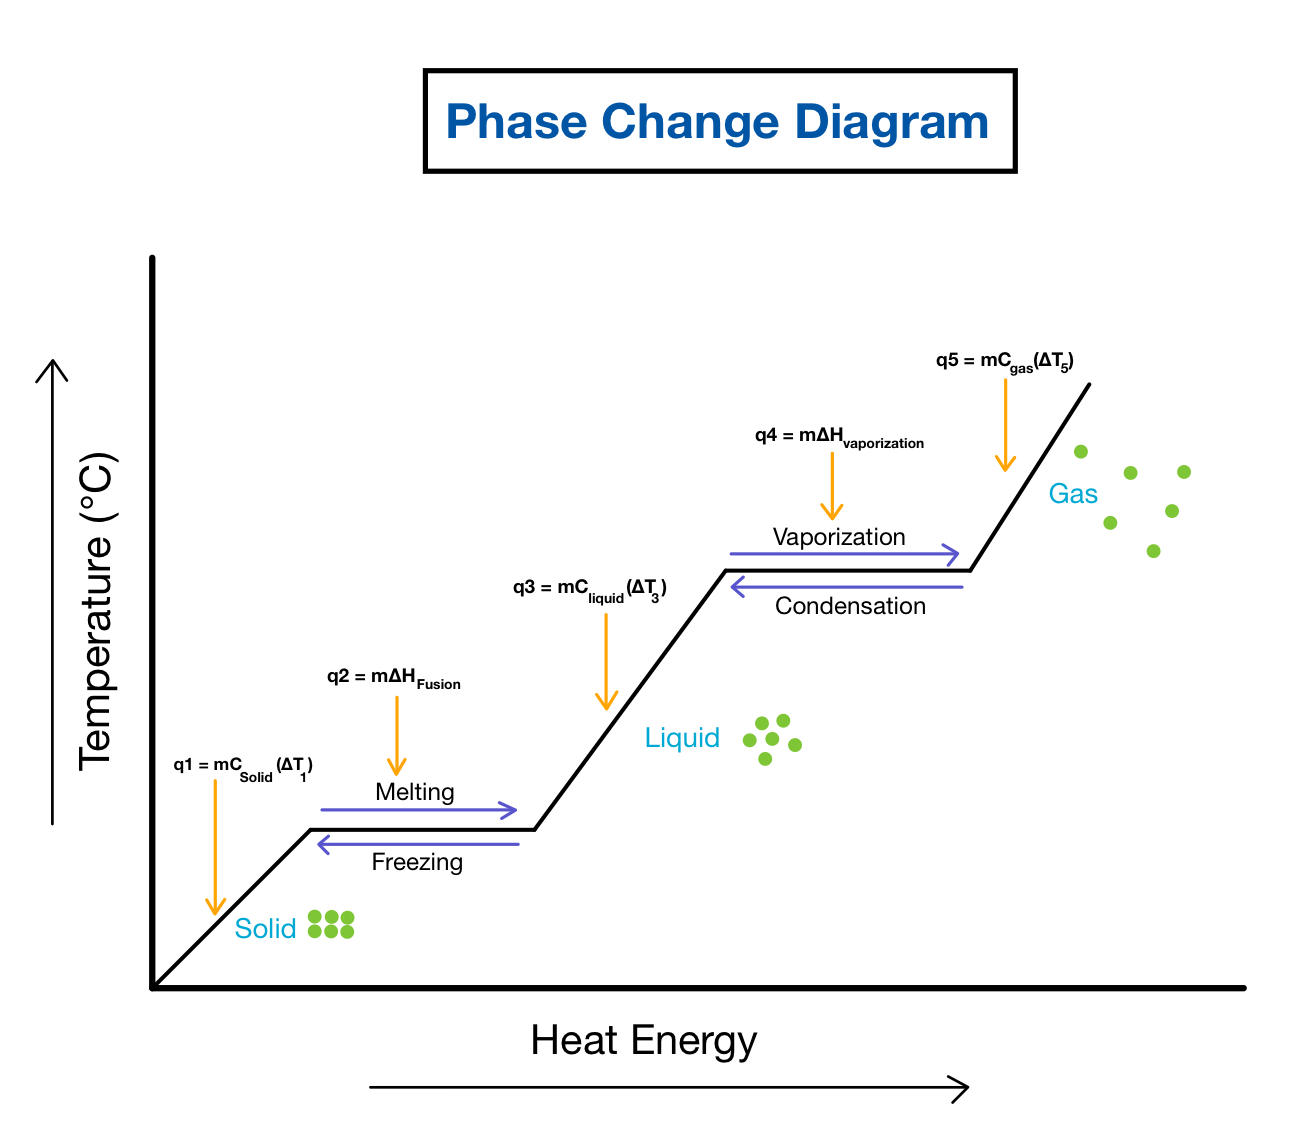
Phase Change Diagrams
Let's say we know our temperature and pressure. How do we determine a substance's phase of matter? We use a phase change diagram! A phase change diagram is a graph. The y-axis is pressure and, the x-axis is temperature. On the chart, you'll find three lines. Each line represents a boundary between phases. All the lines meet at one point, named the triple point. So, the plot divides into three regions. The region furthest to the left is solids, in the middle is liquids and, the right side is the gas phase.
We can develop a phase change diagram for almost any element or molecule. For example, you could look up the phase change diagram for water or carbon dioxide. If you're interested in materials chemistry, they often use phase change diagrams. Many work with metals. For example, different steel alloys have unique phase boundaries. So, when they harden their steel, they need to consider pressure and temperature.
Now, let's examine each part of a phase change diagram.
Sublimation and Deposition Line
Sublimation and deposition are the phase changes between solids and gases. Sublimation is like boiling. The substance's vapor pressure must equal the external pressure. For example, you may have seen dry ice. It's solid carbon dioxide and sublimates at atmospheric pressure. During Holloween parties, we use it to make "fog" come out of punchbowls.
The temperature and pressure of the sublimation-deposition line are relative. As we saw, carbon dioxide sublimates at atmospheric pressure. In contrast, water's sublimation pressure is under 0.006 atmospheres! Since we use SI units, that's only 607 pascals! What you need to know is the boundary is always below the triple point. Above the triple point, our substance can be a liquid. Below it, our substance can only be a solid or gas. So, the sublimation-deposition boundary occurs at lower temperatures and pressures than liquids. It will always be on the left side of the diagram.
Freezing and Melting Line
The freezing-melting boundary is the transition between solid and liquid. Remember, phase changes depend on intermolecular forces. For example, carbon dioxide is a non-polar molecule. It only experiences dispersion forces. So, it only melts above 5 atmospheres. We have to keep the external pressure above the vapor pressure. Typically, it would sublimate. In contrast, water hydrogen bonds. It has significant electrostatic interactions. So, at atmospheric pressure, it will freeze or melt.
Vaporization and Condensation Line
The vaporization-condensation line is the boundary between liquids and gases. We crossed this line when we compressed the container with argon. To convert a liquid to a gas, we need to overcome the intermolecular forces. The easiest way to exceed the electrostatic attractions is to have high temperatures. So, the boundary will be on the right side of the plot.
Critical Point
The critical point is the end of the liquid-gas boundary. Above the critical point, we have a supercritical fluid. Supercritical fluids have incredibly unique physical and chemical properties. For example, supercritical water is expandable and compressible. It is also a terrible solvent for ionic compounds. But, it becomes an excellent solvent for non-polar molecules.
Triple Point
The triple point is when all three phases are in equilibrium. You can look up videos of water at its triple point. You'll see boiling water with ice floating in it. The water is melting, freezing and, boiling at the same time! How cool is that?
Qualitative Trends
Typically, your teacher will ask you to use a phase diagram qualitatively. For example, what happens if you increase the temperature while keeping the pressure constant? The answer depends on the substance, the pressure, and the initial temperature. If you are on a boundary line, you know that the two phases are in equilibrium.