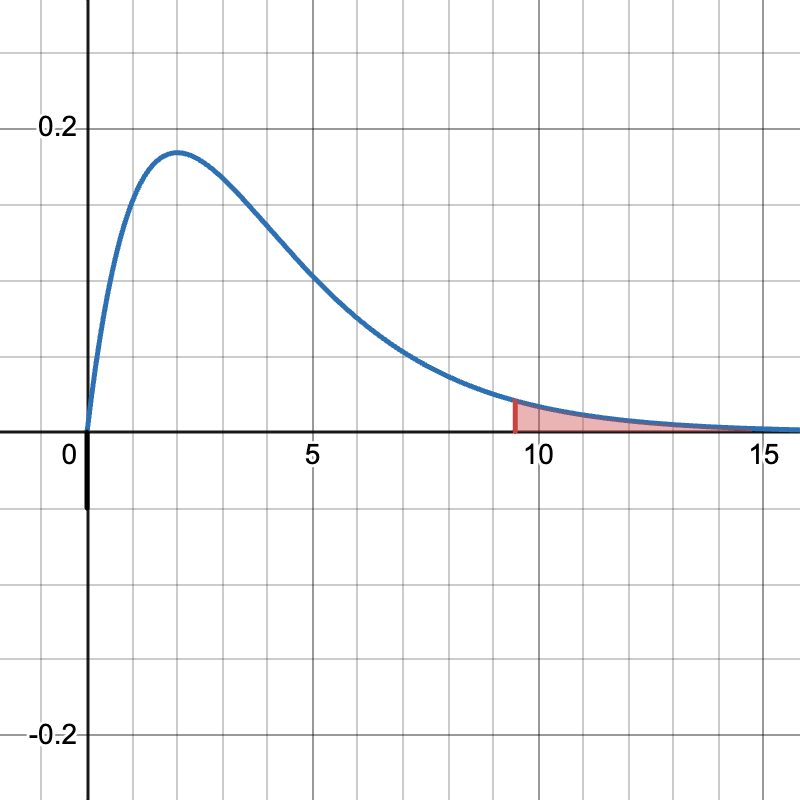
The Chi-Square Distribution
Imagine that you're rolling a fair six-sided die, and you want to see how often each number comes up. If you roll the die a bunch of times, you may notice that each number doesn't always show up exactly the same number of times. Sometimes, one number might come up more often than others, just by chance.
The chi-square distribution helps us to understand the difference between what we expect to happen (like each number on the die coming up equally) and what actually happens in our rolls. Think of it as a special tool for comparing what we see to what we thought we would see.
In goodness of fit testing, the chi-squared distribution is used to evaluate how well observed categorical data match the expected frequencies under a specific theoretical distribution.
How We Use the Chi-Square Distribution
We use the chi-square distribution typically when we have some data and want to see if it fits a certain pattern or distribution. For example, after rolling the die, we might want to check if the numbers are coming up in the way we would expect if the die was fair. The chi-square test helps us figure out if the differences we see are just random chance or if something more interesting is going on.
In hypothesis testing, the chi-squared distribution is used to determine whether observed frequencies differ significantly from expected frequencies under the null hypothesis.
Important Elements
The density function of the chi-squared distribution describes the probability distribution of the test statistic, which depends on the degrees of freedom and helps in assessing the goodness-of-fit in statistical analyses. The distribution function of the chi-squared distribution provides the cumulative probability up to a given value of the test statistic, which is essential for determining p-values in hypothesis testing.
Understanding the standard deviation of the chi-squared distribution helps in assessing how spread out the values of the test statistic are, which is crucial for interpreting the variability and significance of the results in hypothesis testing.
####The Shape of the Distribution
- The chi-square distribution looks different depending on the number of "sides" or categories you have in your data.
- The fewer categories, the distribution is more spread out and can look quite lopsided. With more sides or categories, it starts to look more like a normal distribution.
####Degrees of Freedom
- The shape of the chi-square distribution depends on something called "degrees of freedom". You'll learn more about this topic soon, but right now, just know that it's related to how many categories you are looking at. For the chi-square distribution, it will be one minus the sample size (n). Think: n−1
- For example, if you have six-sided die, you have 5 degrees of freedom (6 sides −1).
How It Helps Us
- When we calculate a chi-square value from our data, we compare it to the chi-square distribution to see if our result is unusual.
- If our result is in the tail end of the distribution (the far-right side), it might mean something interesting is happening and that the differences are not just due to random chance.
Example
Let's say you roll a die 60 times, and you expect each number to come up 10 times if the die is fair. But let's say you get the following:
- 15 ones
- 7 twos
- 12 threes
- 8 fours
- 9 fives
- 9 sixes
You would calculate how different these numbers are from what you expected, and then you'd use the chi-square distribution to see if the differences are just random or if there might be something else going on.
Conclusion
The chi-square distribution is a helpful way for us to see if the differences in our data are what we'd expect by chance or if there's something unusual happening. It's like a magical tool that helps you to understand how well your data fits with what you thought would happen.