Interactive · 1 question

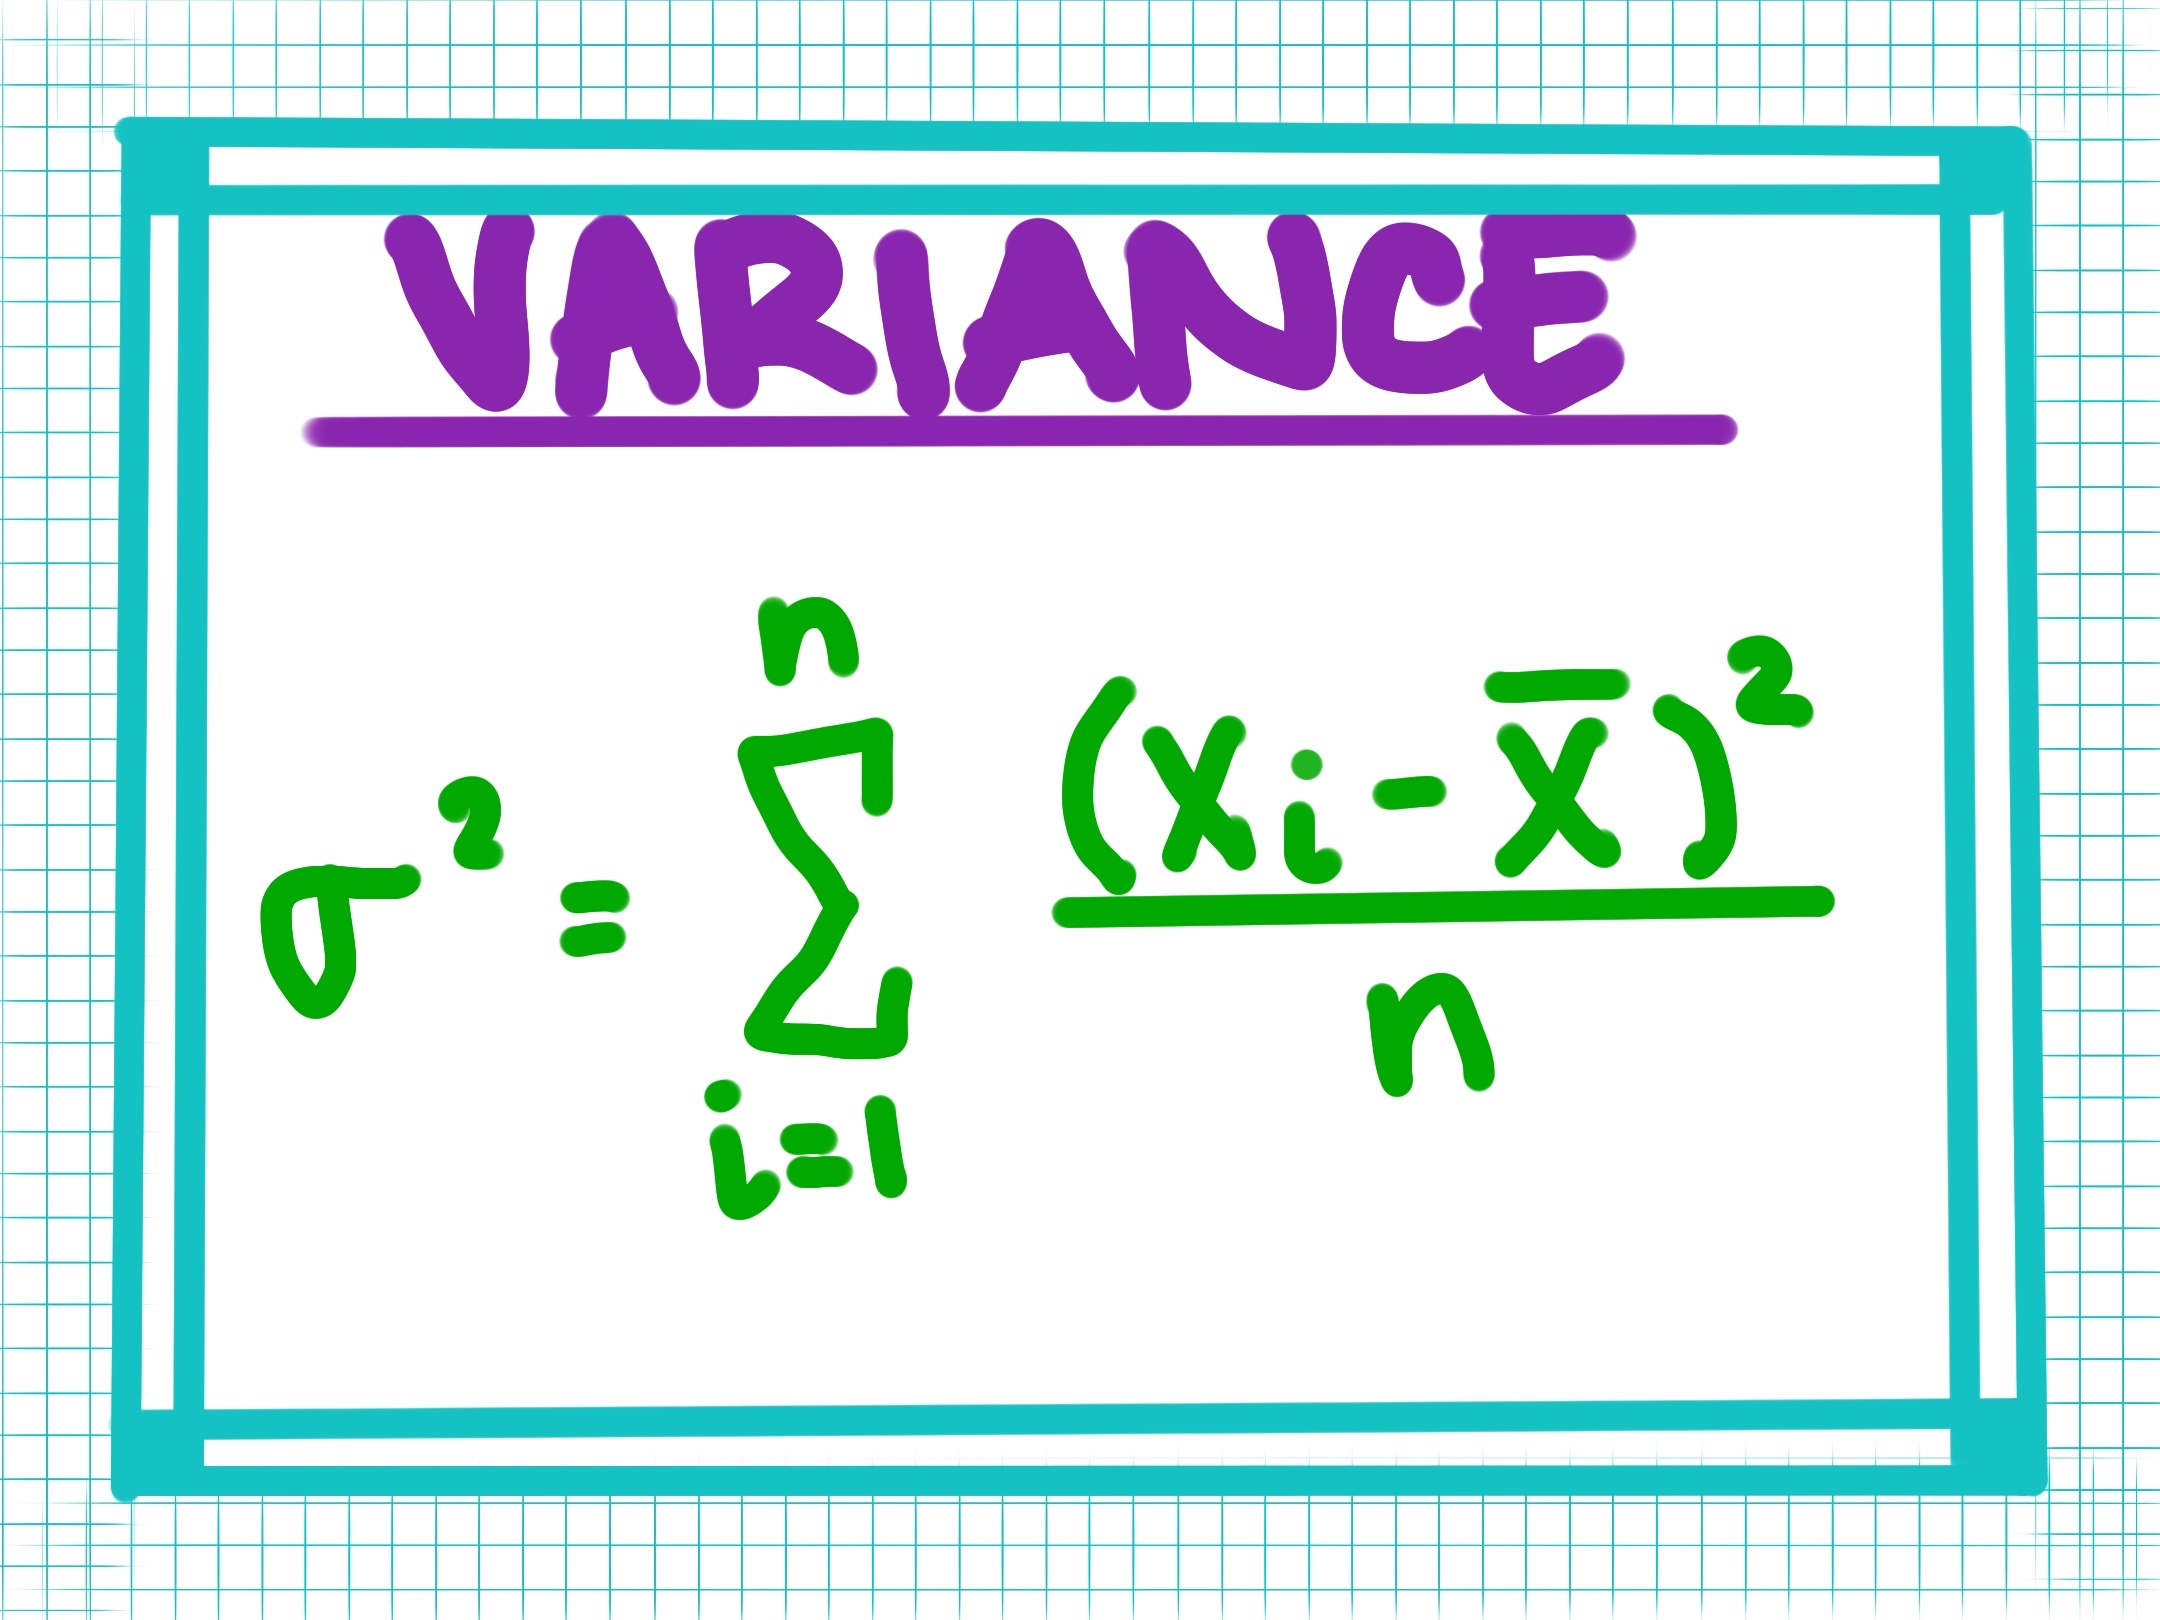
Variance is a very useful calculation in statistics. It quantitatively tells us how spread out a dataset is with respect to its average, and is given by the formula where is the variance, is the th element, is the mean, and is the size of the dataset. (Note: variance is denoted as because it is the square of another important statistical calculation, the standard deviation.)
Let's talk through the formula to make it feel a bit less confusing.
- If we want to know how spread out a dataset is from the mean, it's useful to know the difference between each term and the mean. This is what accomplishes.
- The reason is the square of the aforementioned difference is we want our measure of spread to be a positive value. The square flips the sign of the differences between the mean and elements less than the mean, making them positive and unifying everything.
- The summation sums all these squares of differences across the terms in the dataset.
- Finally, the in the denominator turns the sum we obtained above into an average.
So, variance is ultimately just the average of the squares of differences between the mean of a dataset and each element in the set.
Let's try an example! Consider the dataset
What is the variance of this dataset?
Good job!
Fun side note: if you're sampling a population and taking a variance of that subset of data, it's called a sample variance. The formula is just slightly different: where is the sample variance. The stems from something called Bessel's correction, which accounts for the bias created by only analyzing a subset of the data. If you're feeling adventurous, try looking into Bessel's correction and the proofs behind why it works!