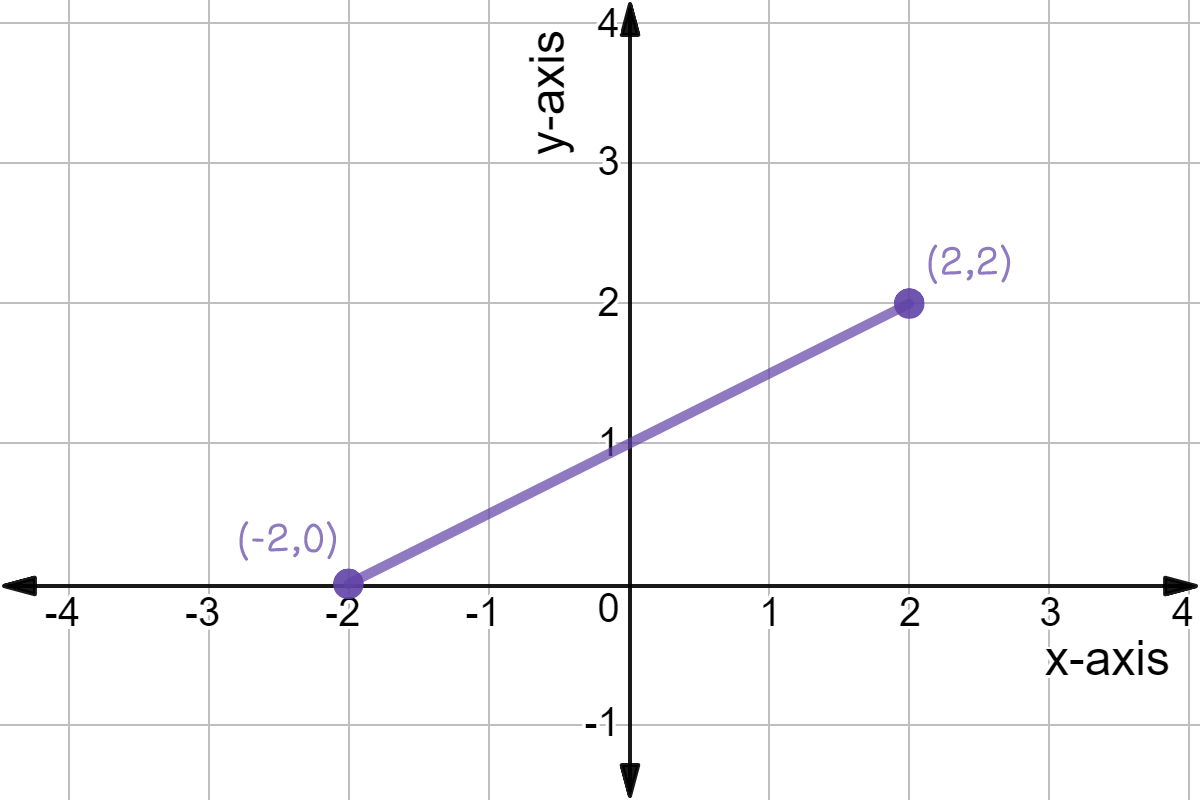
Rate of Change - Definition & Example

Video · + 1 min read

(Video) Slope Formula

by mathman1024

Here's a video by mathman1024 showing you how to find the slope of a line.

Summary\large{\text{Summary}}

slope= rate of change =m=riserun=ΔyΔx\text{slope}=\text{ rate of change } = m=\frac{\text{rise}}{\text{run}}=\frac{\Delta y}{\Delta x}
Rate of change = slope = Δy/Δx = rise/run = the m in y-mx+b = (y2-y1)/(x2-x1)

Image source: By Caroline Kulczycky

In math language, the greek letter, delta, Δ\Delta, means "change".

Slope is the steepness of a line or the rate at which the line changes. We can calculate it by looking at two points and see how much the yy-coordinates change (rise) and how much the xx-coordinates change (run). The formula to solve for the slope is: m=y2−y1x2−x1m=\frac{y_2-y_1}{x_2-x_1}

So if we were given two points, P(5,−7)P(5,-7) and Q(−3,3)Q(-3,3), what would be the slope of the line that they're on? Well we should first label our points: (5,−7) and (−3,3)(x1,y1) and (x2,y2)(5,-7)\text{ and }(-3,3)\\ (x_1,y_1)\text{ and }(x_2,y_2) We can plug these numbers directly into our slope equation! m=3−(−7)(−3)−5=10−8m=\frac{3-(-7)}{(-3)-5}=\frac{10}{-8}

So if we plot our first point, P(5,−7)P(5,-7).

Point P at (5,-7).

Made using Desmos

The rise of the slope is 1010. So let's move our point up by 1010 units.

Point (5,-7) rising to (5,3).

Made using Desmos

The run of the slope is −8-8. So let's move our point to the left by 88 units.

The point P(5,-7) after a rise of 10 and a run of -8 gets to the point Q(3,-3).

Made using Desmos

And now we're at our second point, Q(3,−3)Q(3,-3). These are two distinct, discrete data points.

Illustrated · 2 min

The slope of a line is the rate of change

Rate of Change: The speed at which a variable changes over a specific period of time. It is often used when speaking about momentum, and it can generally be expressed as a ratio between a change in one variable relative to a corresponding change in another. Graphically, this ratio is represented by the slope of a line.

TL;DR: The bigger the slope, the steeper the line.

You'll recognize this average rate of change from the real world: miles per hour!

Average rate of change

Sometimes, graphs won't just be one straight line and will have lots of different slopes. You can find the average rate of change between two points by finding the rise and run between them.

The average rate of change of a function f(x)f(x) over an interval between two points (a,f(a))(a, f(a)) and (b,f(b))(b, f(b)) is the slope of the line connecting the two points: y2−y1x2−x1=f(b)−f(a)b−a\frac{y_2-y_1}{x_2-x_1}=\frac{f(b)-f(a)}{b-a}

Let's think about this in terms of speed. If we start out driving slowly and then pick up speed as we go on, our changes over the course of our drive. However, we can still find our average speed (our average rate of change) the way we would normally find the slope between two points. Take a look at the graph below:

A curve with a line through it.

Made using Desmos

The function that describes our actual speed is in red. The blue line connects the two points that we need to find the average rate of change (slope of the blue line). We can notice that the red line is curving at different rates, so there is different slopes. In order to find an average slope, we want to find the slope of the blue line because of the slope of the blue line is constant.

Examples!

Example 1:

Let f(x)=mx+bf(x) = mx + b. Find the average rate of change of ff between the points where x=ax = a and x=a+hx = a + h by plugging them into the equation for finding the secant line:

f(b)−f(a)b−a\frac{f(b) - f(a)}{b - a}

Solution:

=f(a+h)−f(a)(a+h)−(a)=(m(a+h)+b)−(m(a)+b)a+h−a=(m(a)+m(h)+b−m(a)−bh=m(h)h=m\begin{align} &=\frac{f(a + h) - f(a)}{(a + h) - (a)}\\ &=\frac{(m(a + h) + b) − (m(a) + b)}{a + h - a}\\ &=\frac{(m(a) + m(h) + b − m(a) − b}{h}\\ &=\frac{m(h)}{h}\\ &=m \end{align}

So, the average rate of change is just the normal slope of a linear function!

Example 2:

In this case, we have set of ordered pairs as our data. Since we can calculate rate of change by just using two points, we don't actually need the full function! (year, price)={(1987, 3.91), (1991, 4.21), (1995, 4.35), (1999, 5.06)(2003, 6.03), (2007, 6.88), (2009, 7.50)}\begin{align} \text{(year, price)} = \{&\text{(1987, 3.91), (1991, 4.21), (1995, 4.35), (1999, 5.06)}\\ &\text{(2003, 6.03), (2007, 6.88), (2009, 7.50)\}} \end{align} Calculate the average rate of change of ticket price with respect to time over the period 19991999 to 20092009.

Solution:

y2−y1x2−x1\frac{y_2 - y_1}{x_2 - x_1} =7.50−5.062009−1999=2.4410=0.244\begin{align} &=\frac{7.50 - 5.06}{2009 - 1999}\\ &=\frac{2.44}{10}\\ &=0.244 \end{align}

So, the ticket price increased an average of $0.24\$0.24 per year between 19991999 and 20092009.

This concept of slope will become so important as we start to work more and more with linear and non-linear functions. Spending more time with this concept and practice how to find slopes will help you a lot as we work with more functions and equations!

Video · + 2 min read

(Video) Slope

by Expii

This video by Expii teaches about slope.

Summary\large{\text{Summary}}

What is Slope?

Slope, or rate of change, is essentially the "steepness" of a line. We refer to it as the rise over run because it's the ratio of how much something rises (moved upward or downward) and how much it runs (moves left or right). slope=riserun\text{slope}=\frac{\text{rise}}{\text{run}}

Rise over run depiction for slope.

Made using Desmos

If a road had a horizontal distance of 3 miles3\text{ miles} and a vertical distance of 6 miles6\text{ miles}, what would be its slope?

Choose one answer

Type a concept, like “slope” or “photosynthesis”.

↑ ↓ to choose · Enter to openSearch explanations and problems