Residuals and Goodness-of-Fit
We have already learned what linear regressions are and that they can tell us the relationship between two variables, much similar to correlation coefficients. Residuals can help us determine the strength of a relation between a datapoint and the line of best fit.
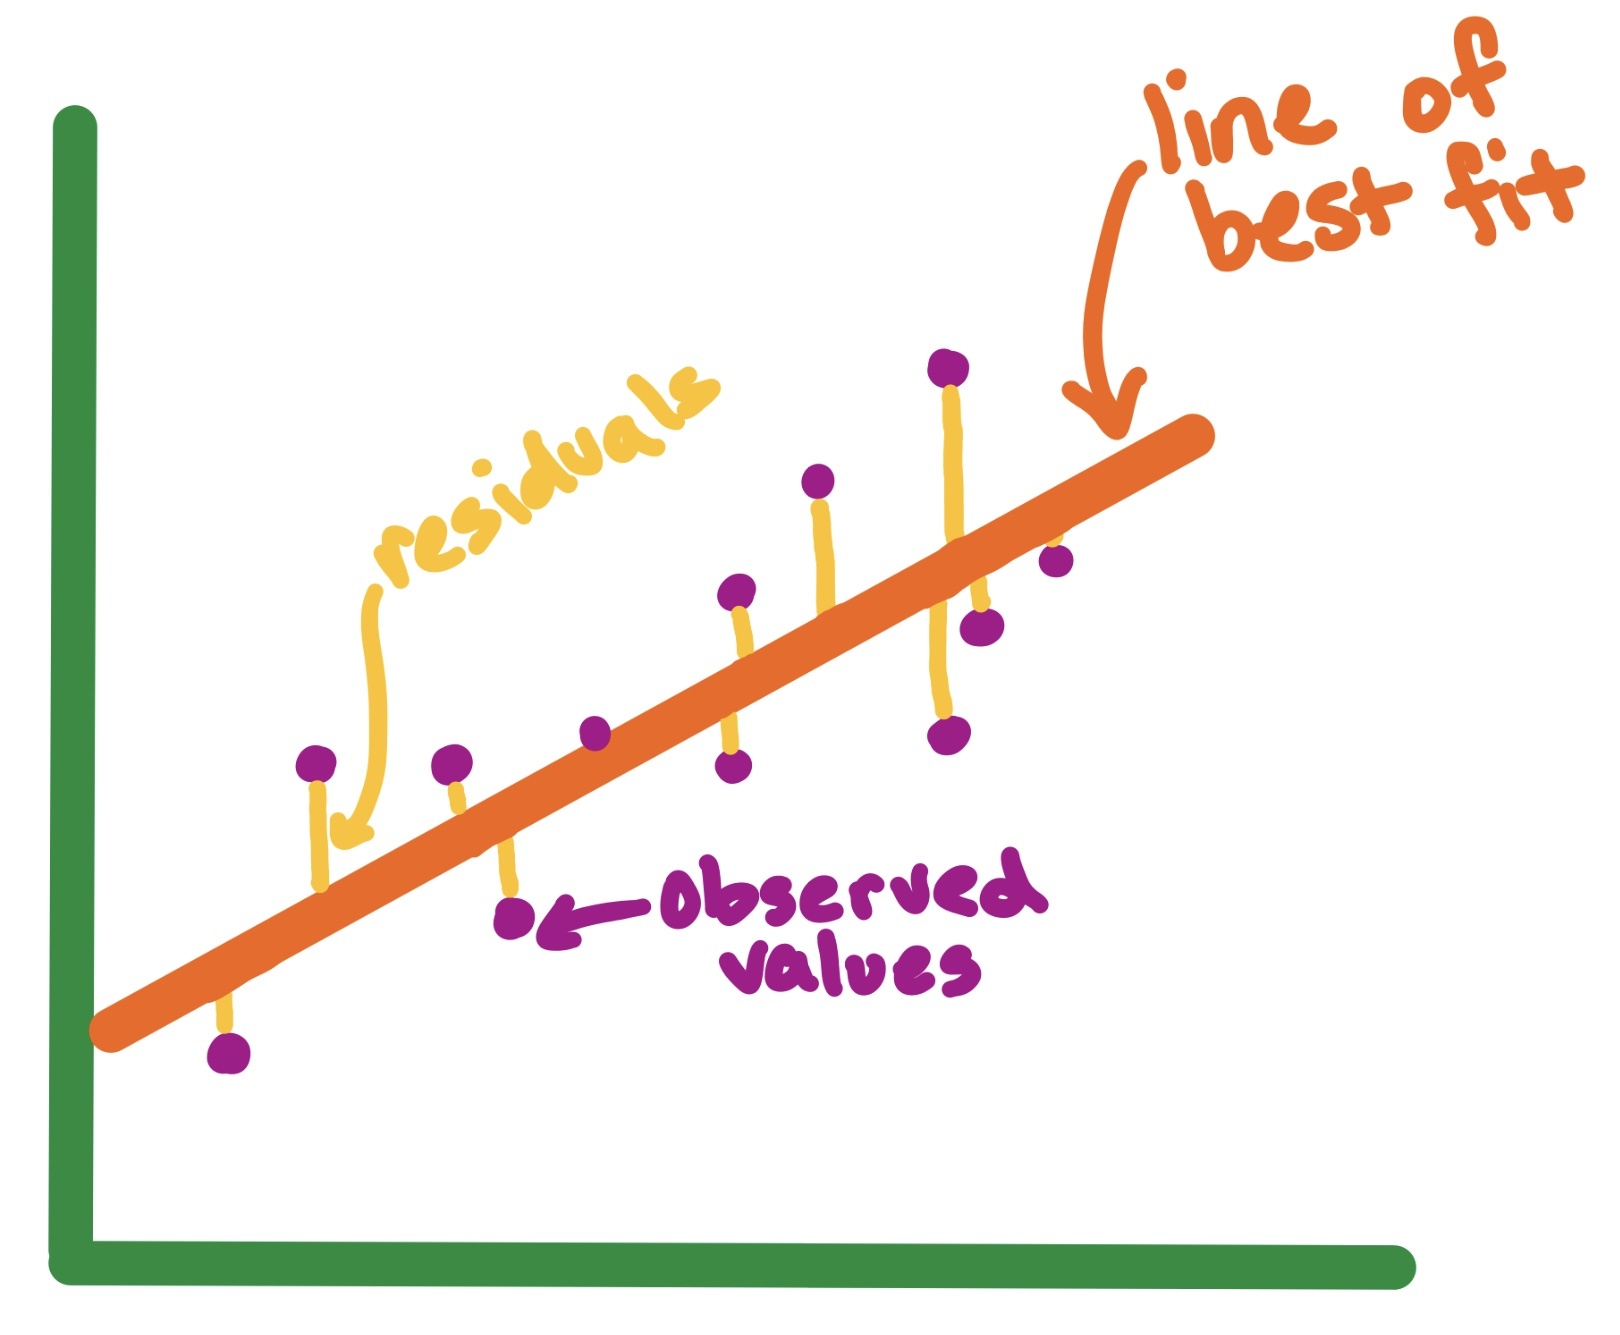
A residual is the distance between a datapoint and the line of best fit.
In statistics, residuals are the differences between what we expect to see in our data and what we actually observe. For example, if we make predictions based on a model, the residual tells us how far off our predictions are from actual results.
Positive residuals are above the line of best fit, while negative residuals are below it, and residuals of zero are when the point is on the line.
The formula for a residual is:
Residual = observed value - predicted value
An important point to know is that the sum and mean of the residuals equals 0.
####Residuals and Goodness-of-Fit
When we try to see how well our model explains the data, we perform a goodness of fit test. This test helps us understand if our model fits the categorical data we collected. These tests check if the observed counts (the data we collected) match what we expected. One common test is the chi square test.
We can look at the value of a residual to determine the goodness-of-fit. Essentially, we want smaller residual values, as that means the linear regression is a good fit as the residuals are close to the line of best fit. If the residuals are very large, the datapoints aren't close to the line, meaning the model is not as strong.
Overall, residuals can help us interpret linear regression models.
####Other Important Terms
- The expected count is what we would expect to see if the null hypothesis were true. We calculate this based on the total number of observations and the proportions we expect in each category.
- To understand how to use the chi square test, we also need to know about degrees of freedom. This tells us how many categories we have minus one. It helps us understand how many different ways our data can vary.
- Another test we can use is the Kolmogorov Smirnov test. This test helps us compare the distribution of our observed data to a theoretical distribution. It's useful for checking if our data follows a certain pattern.