Read · 4 min

Background
In the last few lessons, you've been learning about how to use and manipulate data, in the form of probability and statistics. The next few lessons will cover types of sampling and sampling biases. However, before we dive into sampling, we want to first understand the different types of data and measurement that we can use in math. Not all types of data are the same. In this lesson, we will learn how to differentiate them.
Scales of Measurement
Inherently, we know that there are different types of data. In chemistry, you may have learned about qualitative vs. quantitative data. These are the two most broad categories of data because they essentially tell you whether data can be counted (quantitative) or not counted (qualitative).
Back in Algebra 1, you learned about the two types of quantitative data, continuous and discrete data. Continuous data does not have any gaps when graphed, while discrete data shows up as individual points on a graph.
We can choose to see data in a different way, based on its scales of measurement.
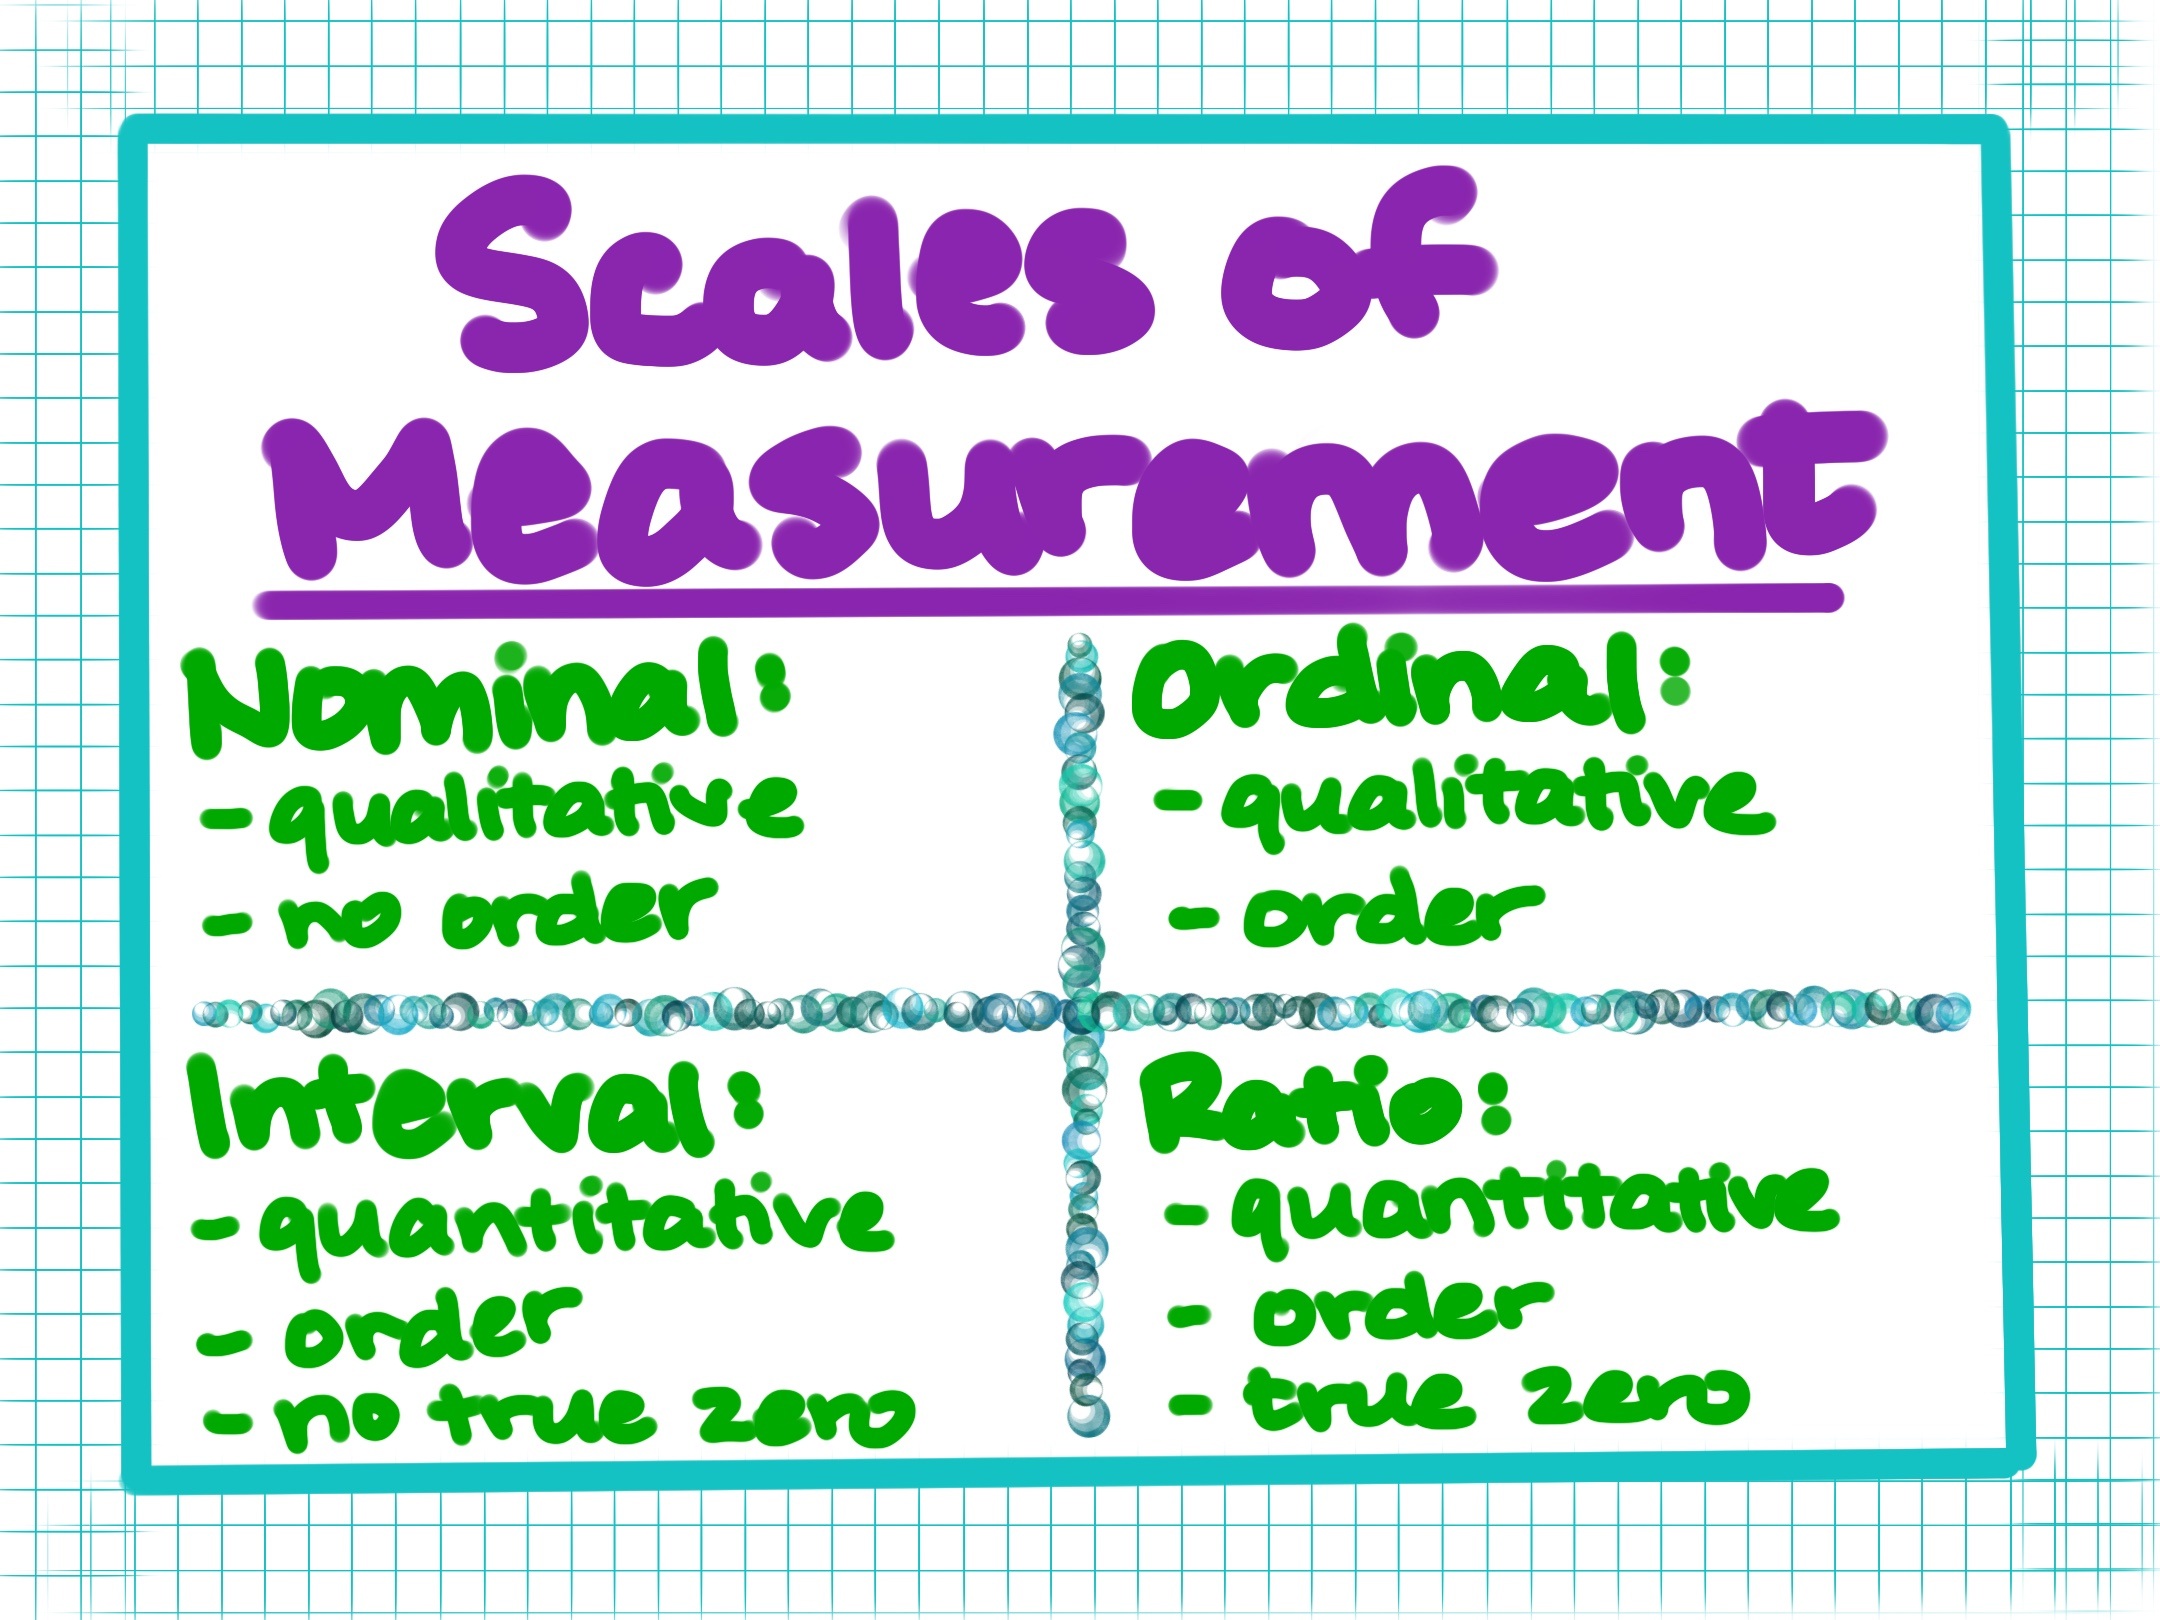
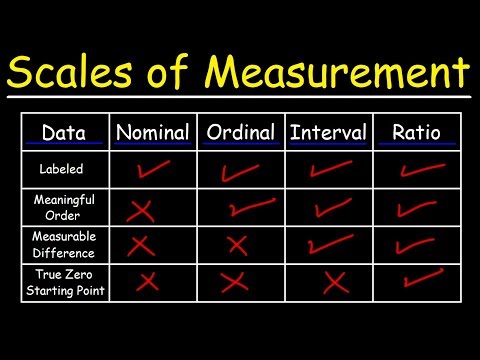
There are four types of data: nominal, ordinal, interval, and ratio. Each one of these types is its own level of data, with its own characteristics and its own uses.
Nominal Data
We'll start with nominal data. Nominal data is also known as categorical data because it is data that can be separated into categories. This data is generally qualitative, in that there are no numbers involved.
Say you're going bowling with your friends tonight. Some of you prefer the -pound blue bowling balls, and others of you prefer the -pound pink ball. When you get to the lane, you start to separate the bowling balls into different categories, based on what weight & color people prefer. This is an example of nominal data because the order of the bowling balls doesn't matter and there are just categories to separate the different bowling balls.
Key Features of Nominal Data:
-
Qualitative, categorical data (no numbers!)
-
Order doesn't matter
Ordinal Data
Next up, we've got ordinal data. Ordinal data is very similar to nominal data, but there's one major difference: order matters. Just like the name suggests, ordinal data has a specific order that it shows up in. If you can rank the data in a particular order, then the data is ordinal.
For example, you are trying out different salsas at your local Mexican restaurant. You start with the pico de gallo, which is very mild. You then switch to the mild salsa, which is a little spicier. After that, you move onto the medium salsa, which is getting a little hot for you. You decide to take a risk, and you try to hot salsa, which is very spicy. The types of salsa are ordinal, as there is a specific order of spiciness. It doesn't matter how different the spice levels are, though. The order of salsa is: pico de gallo, mild, medium, and hot.
Key Features of Ordinal Data:
-
Qualitative, categorical data (no numbers!)
-
Order matters
-
There is no set ratio between items in the list
Interval Data
Interval data is data that has a set order and the difference between two data points can be quantified. That means that the gap, or distance, between two items is measurable. You should be able to put interval data points, in order, on a numerical scale. In addition, interval data has no true zero, meaning that there is no point at which "nothing" exists on the scale. True zero indicates that there is no item or data point that is lower than true zero.
The most common example of interval data is temperature! Whether we use Fahrenheit or Celsius, there is an equal distance between each degree, , and the degrees can be put in numerical order. We can see that temperature has no true zero, because you can go into the negative degrees.
Key Features of Interval Data:
-
Quantitative data (with numbers!)
-
Order matters
-
There is a set ratio between items in the list
-
No true zero
Ratio Data
Ratio data is a simple extension of interval data. The main difference between ratio data and interval data is that ratio data has a true zero. That means that there is a point on interval data where there are no lower values.
An example of ratio data is height. We know that we can measure height quantitatively, and there is a set order to feet and inches. There is also an equidistant ratio between each inch, and that gap is measurable. But we also know that a person cannot be inches tall. That means that there is a true zero because you can't go below inches.
Key Features of Interval Data:
-
Quantitative data (with numbers!)
-
Order matters
-
There is a set ratio between items in the list
-
True zero