Interactive · 1 question
+2 contributors


Graphs of
Pretend you had some nasty function and you just finished figuring out how it works. But then the teacher tells everybody, "Graph !!!"
Oh no! Do we have to plug in to every and expand everything out?
Hopefully not. Let's see if there is any pattern.
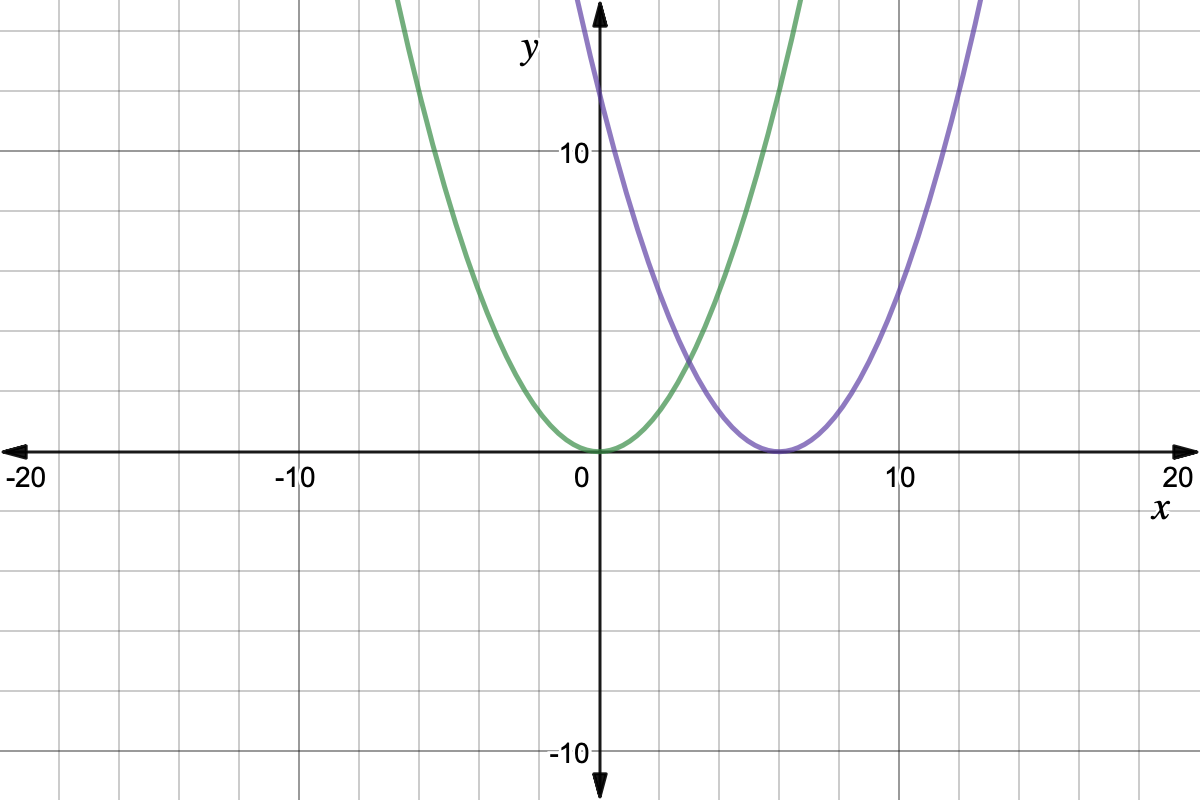
The blue functions are the original s, and the red functions are the changed s.

Graph courtesy of Desmos
What is the doing to the functions?
(Hint: Look at where they cross the x-axis)
So for any , it is simply translated left units.
But why does this happen? And why left?
If we analyze the x-values, we can see a pattern. Which new do we need to get ? The one that makes , or .
We can extend this for any :
So the new x-values are simply the old ones translated units, or units to the left, since that direction is the negative direction.