Illustrated · 1 min

+2 contributors


Square Root Graph
We've seen how to graph different functions, like a linear function and a quadratic function. Most of these types of standard functions have parent graphs, which are basically graphs of the basic function. For example, we know that the parent function of a linear equation is , where the line goes through the origin, (0,0), and has a slope of . In this lesson, we will explore the parent function of another type of equation: the square root equation.
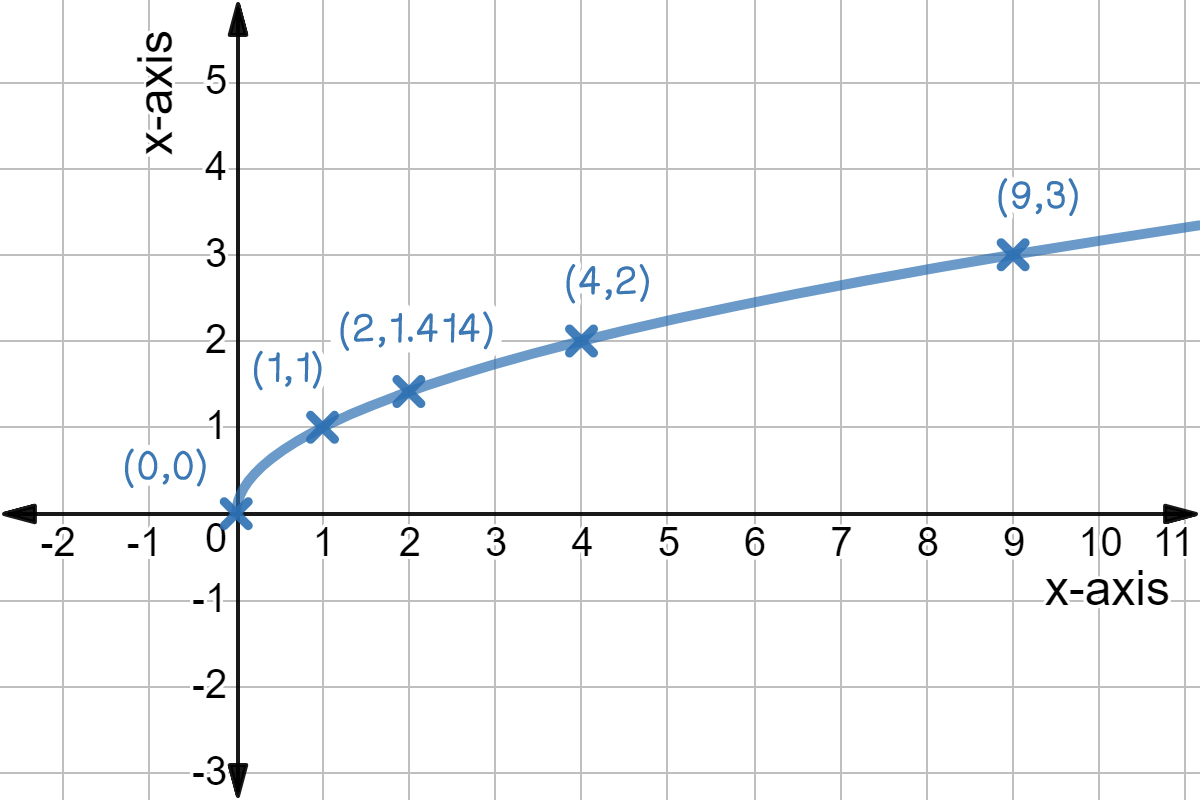
The base square root graph is: .

Made with Desmos
Notice it starts at the point and goes through the point . The value continues to increase, and the value will plateau and increase infinitesimally.
Stretch and Shrink
Like other parent functions, we can also stretch or shrink the graph:
- If is greater than () the graph gets stretched.
- If is between and () the graph gets shrunk.

Made with Desmos
You can also shift the graph to the left, right, up, and down. The best way to graph a square root function is to create a table of values, calculate coordinates, and plot a few points! Then, you can follow the points because you know what the general patten will be.
We can use this basis to solve word problems with radical equations!