Illustrated · 2 min

Standard Deviation

We've covered the measures of central tendency: mean, median, mode, and range.

Say you have two sets of numbers:

{−100,−50,−49,0,1,2,1000}\{-100, -50, -49, 0, 1, 2, 1000\} {−5,−4,−3,−2,−1,0,1,2,3,4,5}\{-5, -4, -3, -2, -1, 0, 1, 2, 3, 4, 5\}

There's something big to notice about the first set as opposed to the second set! Well, the numbers in the first set seem a lot more spread apart, while the numbers in the second set are closer together. Let's take a look at the means of the two sets.

The mean of the first set is around 115115 and the mean of the second set is 00. The mean for the second set makes sense - all the numbers are evenly spaced and fairly close to 00. For the first set, however, none of the numbers in the set seem to be close to the mean at all! That's because the numbers in the first set are very spread out.

There's actually a way to measure how 'spread out' numbers are: it's called the standard deviation (also represented by σ\sigma) of a data set.

Let's say that the government is looking at two schools: North School and South School. The South School has a much higher mean test score than the North School. The government's first reaction is to say that the kids at South School are smarter. But then they look at the standard deviation and see that it is quite large. This means that there are a few scores that aren't close to the mean, which increases the standard deviation.

The kids getting the high scores are only a very small part of the population of the school as a whole, so that doesn't necessary speak for the intelligence of the entire class. The government would have to look closer at the scores.

Graphically, here's what the standard deviation looks like on a normal set of data:

Standard deviation graph

Image source: By Caroline Kulczycky

The pink area represents the scores within one standard deviation away from the mean. These are the kids who score average or close to average. The turquoise area represents the kids who are one to two standard deviations from the mean. The kids in the left turquoise area maybe need to think about improving their scores while the kids on the right turquoise area are doing pretty well. The yellow area represents the kids who are two to three standard deviations away from the mean. On the left yellow area...well, those kids probably failed. But the right yellow area represents the kids who scored from 95%95\% to about a 100%100\%! They're doing really well!

Understanding the concept is very important, but here is the formula in case you actually want to calculate it!

Standard deviation indicates how spread out the data is. σ=√[Σ(x-x̄)²/n]

Image source: By Caroline Kulczycky

In other words, σ=∑i=0n(xi−xˉ)2n\sigma = \sqrt{\frac{\sum_{i=0}^{n}(x_i-\bar{x})^2}{n}} xi= one of the data pointsxˉ= the meann= the total number of data points\begin{align} x_i &= \text{ one of the data points}\\ \bar{x}&=\text{ the mean}\\ n&= \text{ the total number of data points} \end{align} ∑i=0n(xi−xˉ)2\sum_{i=0}^{n}(x_i-\bar{x})^2 means that for each data point xi,x_i, find (xi−xˉ)2,(x_i-\bar{x})^2, then add all of those new values together (i.e., sum of squared values).
Read · 1 min

Standard Deviation In Four Easy Steps!

Standard deviation is a measure of how spread out data is. Higher standard deviation means more spread out, and vice versa.


  1. Work out the mean (average of the numbers in the data set).

  2. Subtract the mean from each number and square the result.

  3. Find the mean of those squared differences.

  4. Take the square root of the mean you just calculated.


The population standard deviation is a parameter, which a fixed value, based on the entire population. The sample standard deviation is a statistic, based on a subset of the population. A high standard deviation indicates that the datapoints are pretty far from the mean, while a low standard deviation indicates that the data is pretty concentrated around the mean.

Example

Suppose you have four quiz scores: 1, 4, 8, and 9

  1. The mean of these four number is (1+4+8+9)4=5.5\frac{(1 + 4 + 8 + 9)}{4} = 5.5

  2. Subtract the mean from each number and square the result.

(1−5.5)=−4.5(1-5.5) = -4.5 -> (−4.52)=20.25(-4.5^2) = 20.25

(4−5.5)=−1.5(4-5.5) = -1.5 -> (−1.52)=2.25(-1.5^2) = 2.25

(8−5.5)=3.5(8-5.5) = 3.5 -> (3.52)=12.25(3.5^2) = 12.25

(9−5.5)=4.5(9-5.5) = 4.5 (4.52)=20.25(4.5^2) = 20.25

  1. Find the mean of those squared differences.

(20.25+2.25+12.25+20.25)4=13.75\frac{(20.25 + 2.25 + 12.25 + 20.25)}{4} = 13.75

  1. Take the square root of the mean you just calculated.

13.75≈3.708\sqrt{13.75} \approx 3.708

Video

(Video) Standard Deviation

by DATAtab

In this video by DATAtab, you will learn about the basics of standard deviation and how to find standard deviation.

Summary

This video explains what standard deviation is and how it measures the spread of data around the mean.

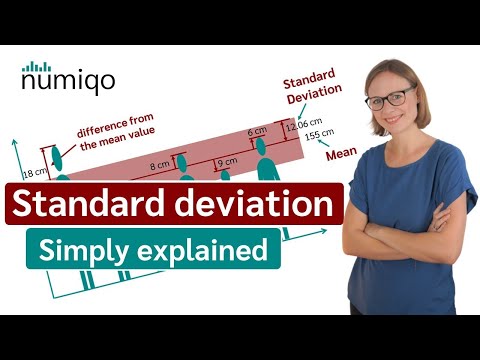
We can see an example using the heights of a group of people. Each value in this sample can be different from the mean. To calculate the standard deviation, you need to find the squared differences from the mean, find their average, and take the square root.

You will also learn why standard deviation uses squared differences, instead of simply averaging the difference. You will also learn the difference between two standard deviation formulas that use nn and n−1n-1.

Hint: nn is used for an entire population, while n−1n-1 is used when a sample is used to estimate a population.

Type a concept, like “slope” or “photosynthesis”.

↑ ↓ to choose · Enter to openSearch explanations and problems

