Illustrated · 1 min

We have learned about a lot of different ways to describe variability in statistics, from standard deviation to standard error. Now we will learn about the mean absolute deviation (MAD).

##Mean absolute deviation

MAD is very similar to the standard deviation, as both look at how variable a dataset is. However, the mean absolute deviation looks at the average distance between the datapoints and the mean. Graphically, this can be seen on a number line in a dot plot.

##How to calculate the mean absolute deviation

  1. Calculate the average of all the datapoints.
  2. Take each datapoint and subtract the mean from the value. In other words, ∣datapoint−mean∣|datapoint - mean|. Disregard any negative signs. These are called "deviations".
  3. Take the average of all these deviations.

Here is what MAD looks like in one formula:
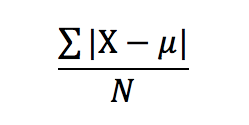
Mean absolute deviation formula. Sum of the absolute value of each datapoint minus the mean, all divided by the sample size.

Image source: by Trisha

Looks fairly straightforward!

##Let's look at an example!

We are given a dataset of the number of seeds found in different oranges.

Dataset: 10,14,6,8,9,7,13,11,7,12,18,510, 14, 6, 8, 9, 7, 13, 11, 7, 12, 18, 5

Following the steps above, we can calculate the average of the dataset.

Average = 1010.

Next, let's take each value and subtract it from the mean. As there are so many datapoints, we'll do only a few examples.

∣10−10∣=0|10-10| = 0 ∣14−10∣=4|14-10| = 4 ∣6−10∣=4|6-10| = 4

→\rightarrow do the same for all the datapoints!

After you have finished calculating the deviations, check your answers with ours!

Deviations: 0,4,4,2,1,3,3,1,3,2,8,50, 4, 4, 2, 1, 3, 3, 1, 3, 2, 8, 5

Now, let's take the average of these deviations, which is 33.

Therefore, MAD = 33!

Exciting - now you have one more tool for a measure of variability!
Illustrated · 1 min

Mean Absolute Deviation

The next aspect of standard deviation that we will talk about is Mean Absolute Deviation (MAD).

Mean Absolute Deviation

Image source: by Anusha Rahman

MAD is the average between the distances of each data point and the mean value. With the formula, we are finding the sum of the distances between each data point and the mean, then dividing that value by the number of data points there are.

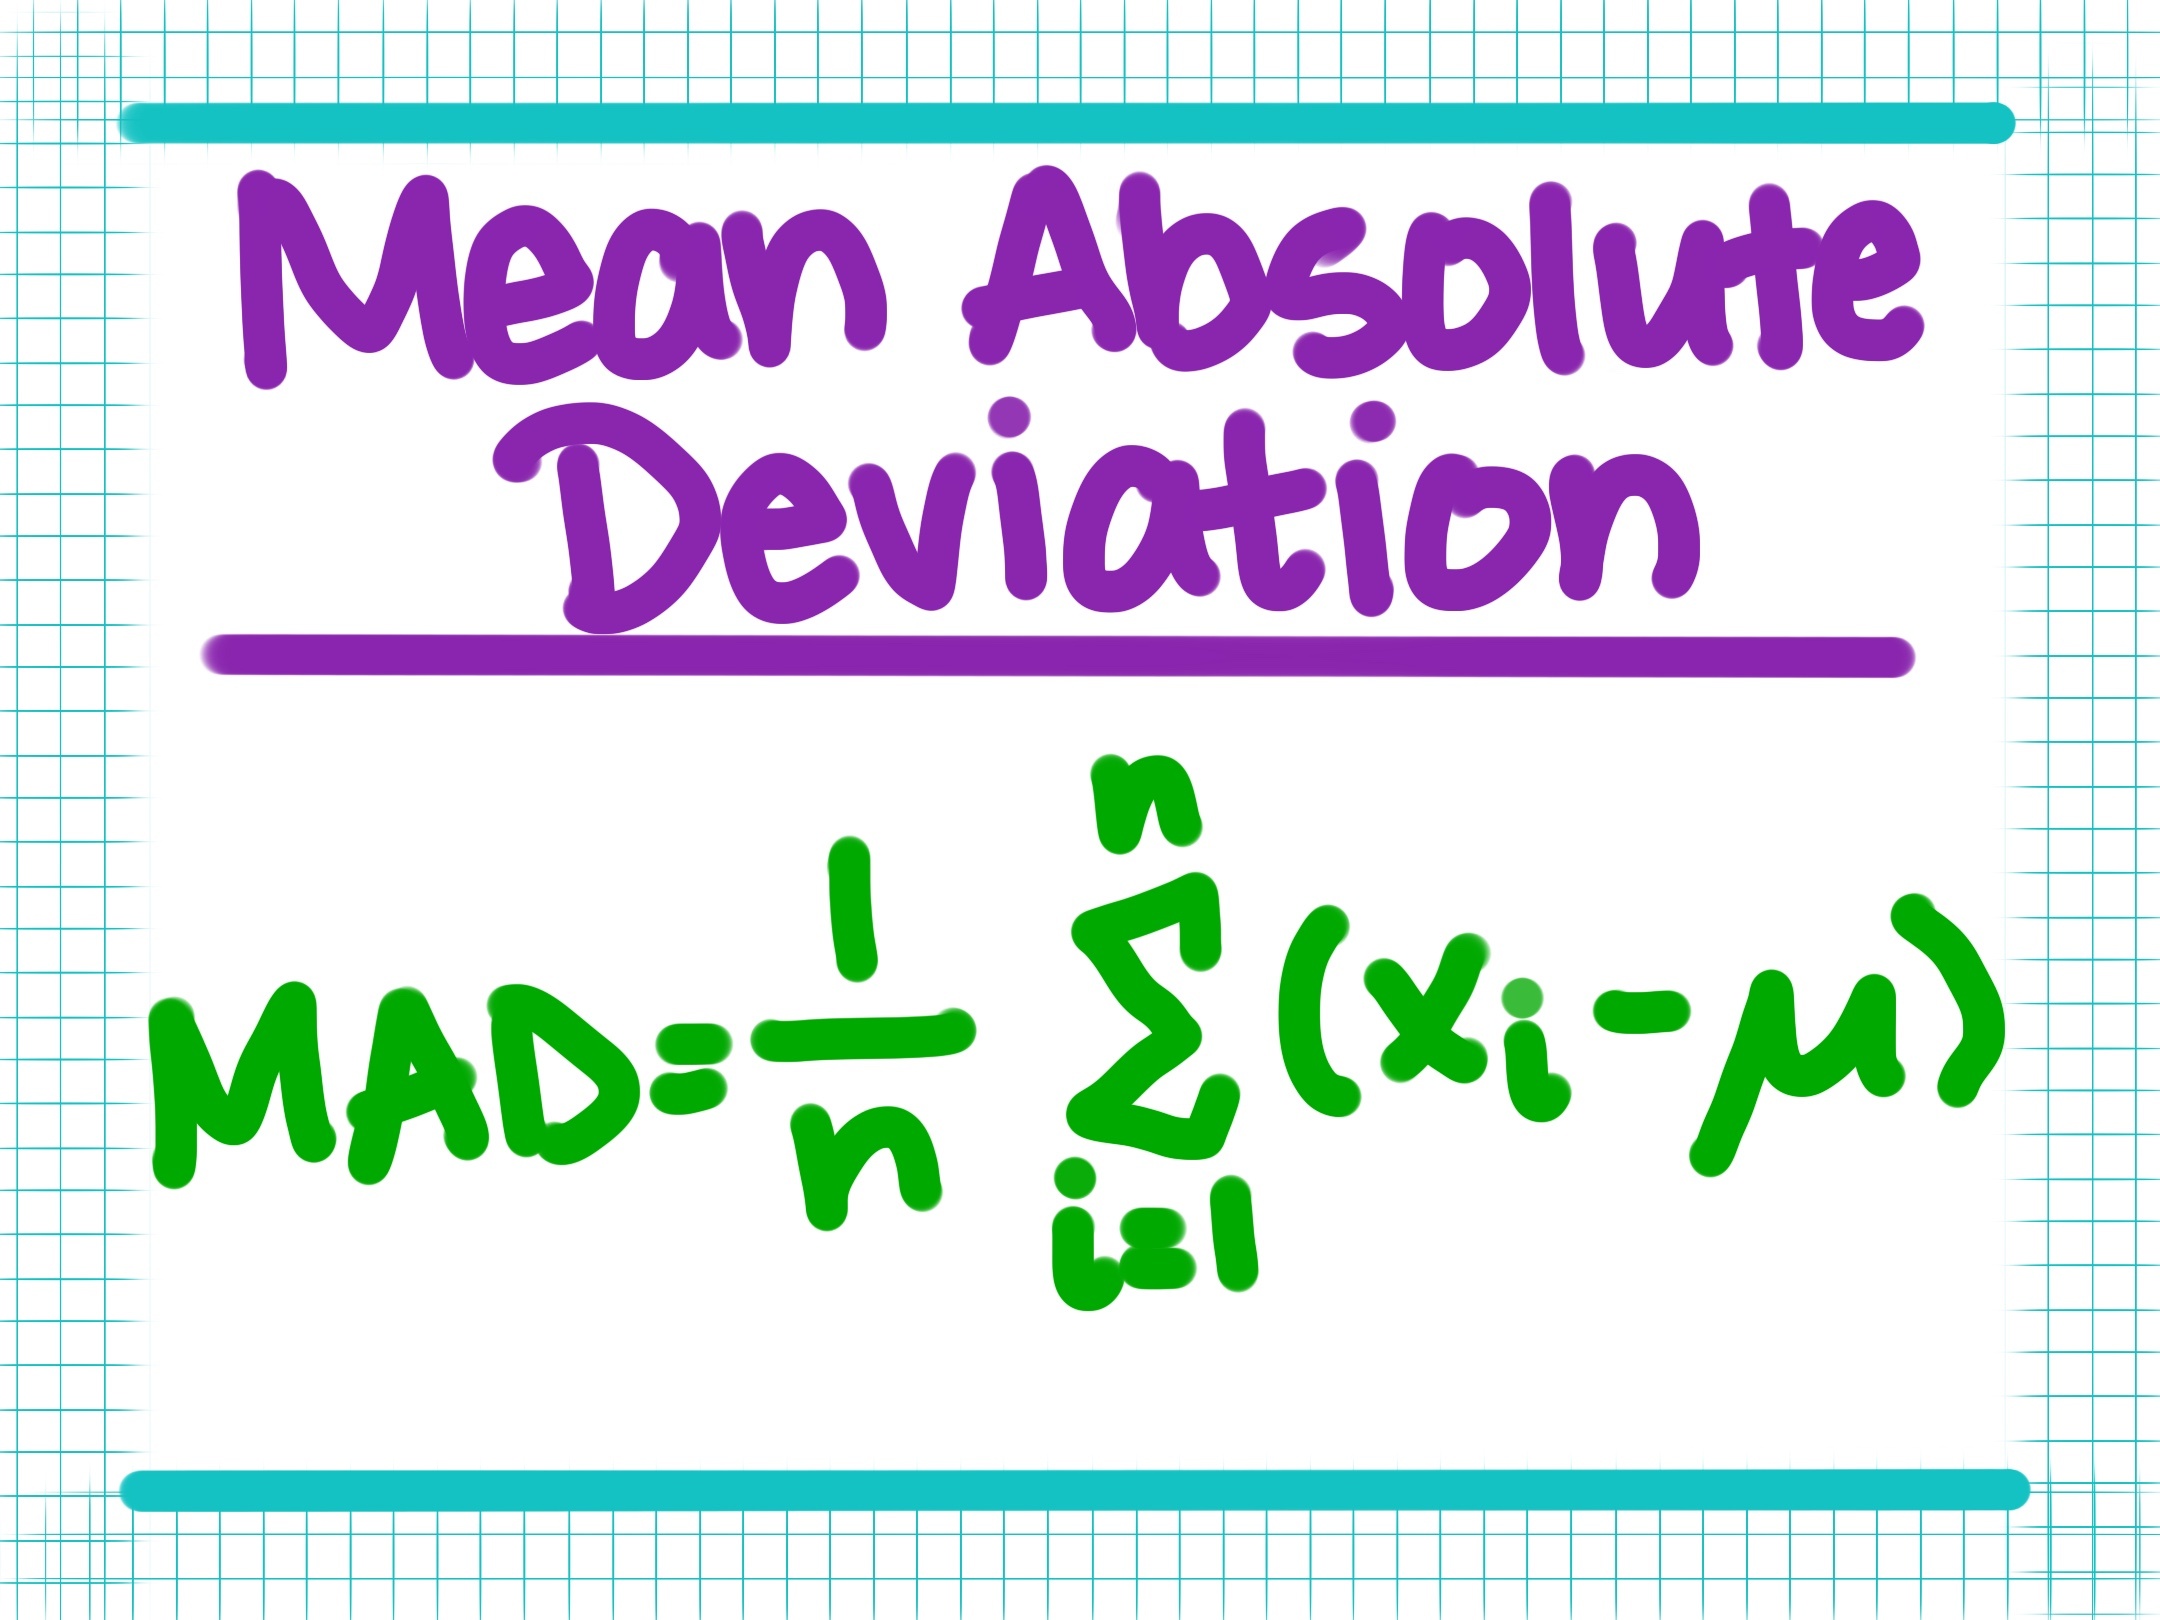
The formula for MAD is:

MAD=1n⋅∑i=1n(xi−μ)\text{MAD} = \frac{1}{n} \cdot \sum^{n} _{i=1} (x_i - \mu)

, where nn is the number of values in the dataset, xix_i is the value of the data point, and μ\mu is the average of the dataset.

Video

(Video) Mean Absolute Deviation (MAD)

by Math with Mr. J

In this video by Math with Mr. J, you will learn about MAD.

Summary

This video explains what mean absolute deviation is and how it measures the spread of data around the mean.

You will see an example using a set of six numbers. First, you find the mean of the dataset. Then, you find the absolute distance between each number and the mean. Next, you add these distances and divide by the number of values in the dataset.

You will learn that mean absolute deviation tells you how far the numbers are from the mean on average. A higher MAD means the data is more spread out, while a lower MAD means the numbers are closer together.

MAD uses absolute values so that all distances from the mean are positive.

Type a concept, like “slope” or “photosynthesis”.

↑ ↓ to choose · Enter to openSearch explanations and problems