Illustrated · 1 min
+1 contributors

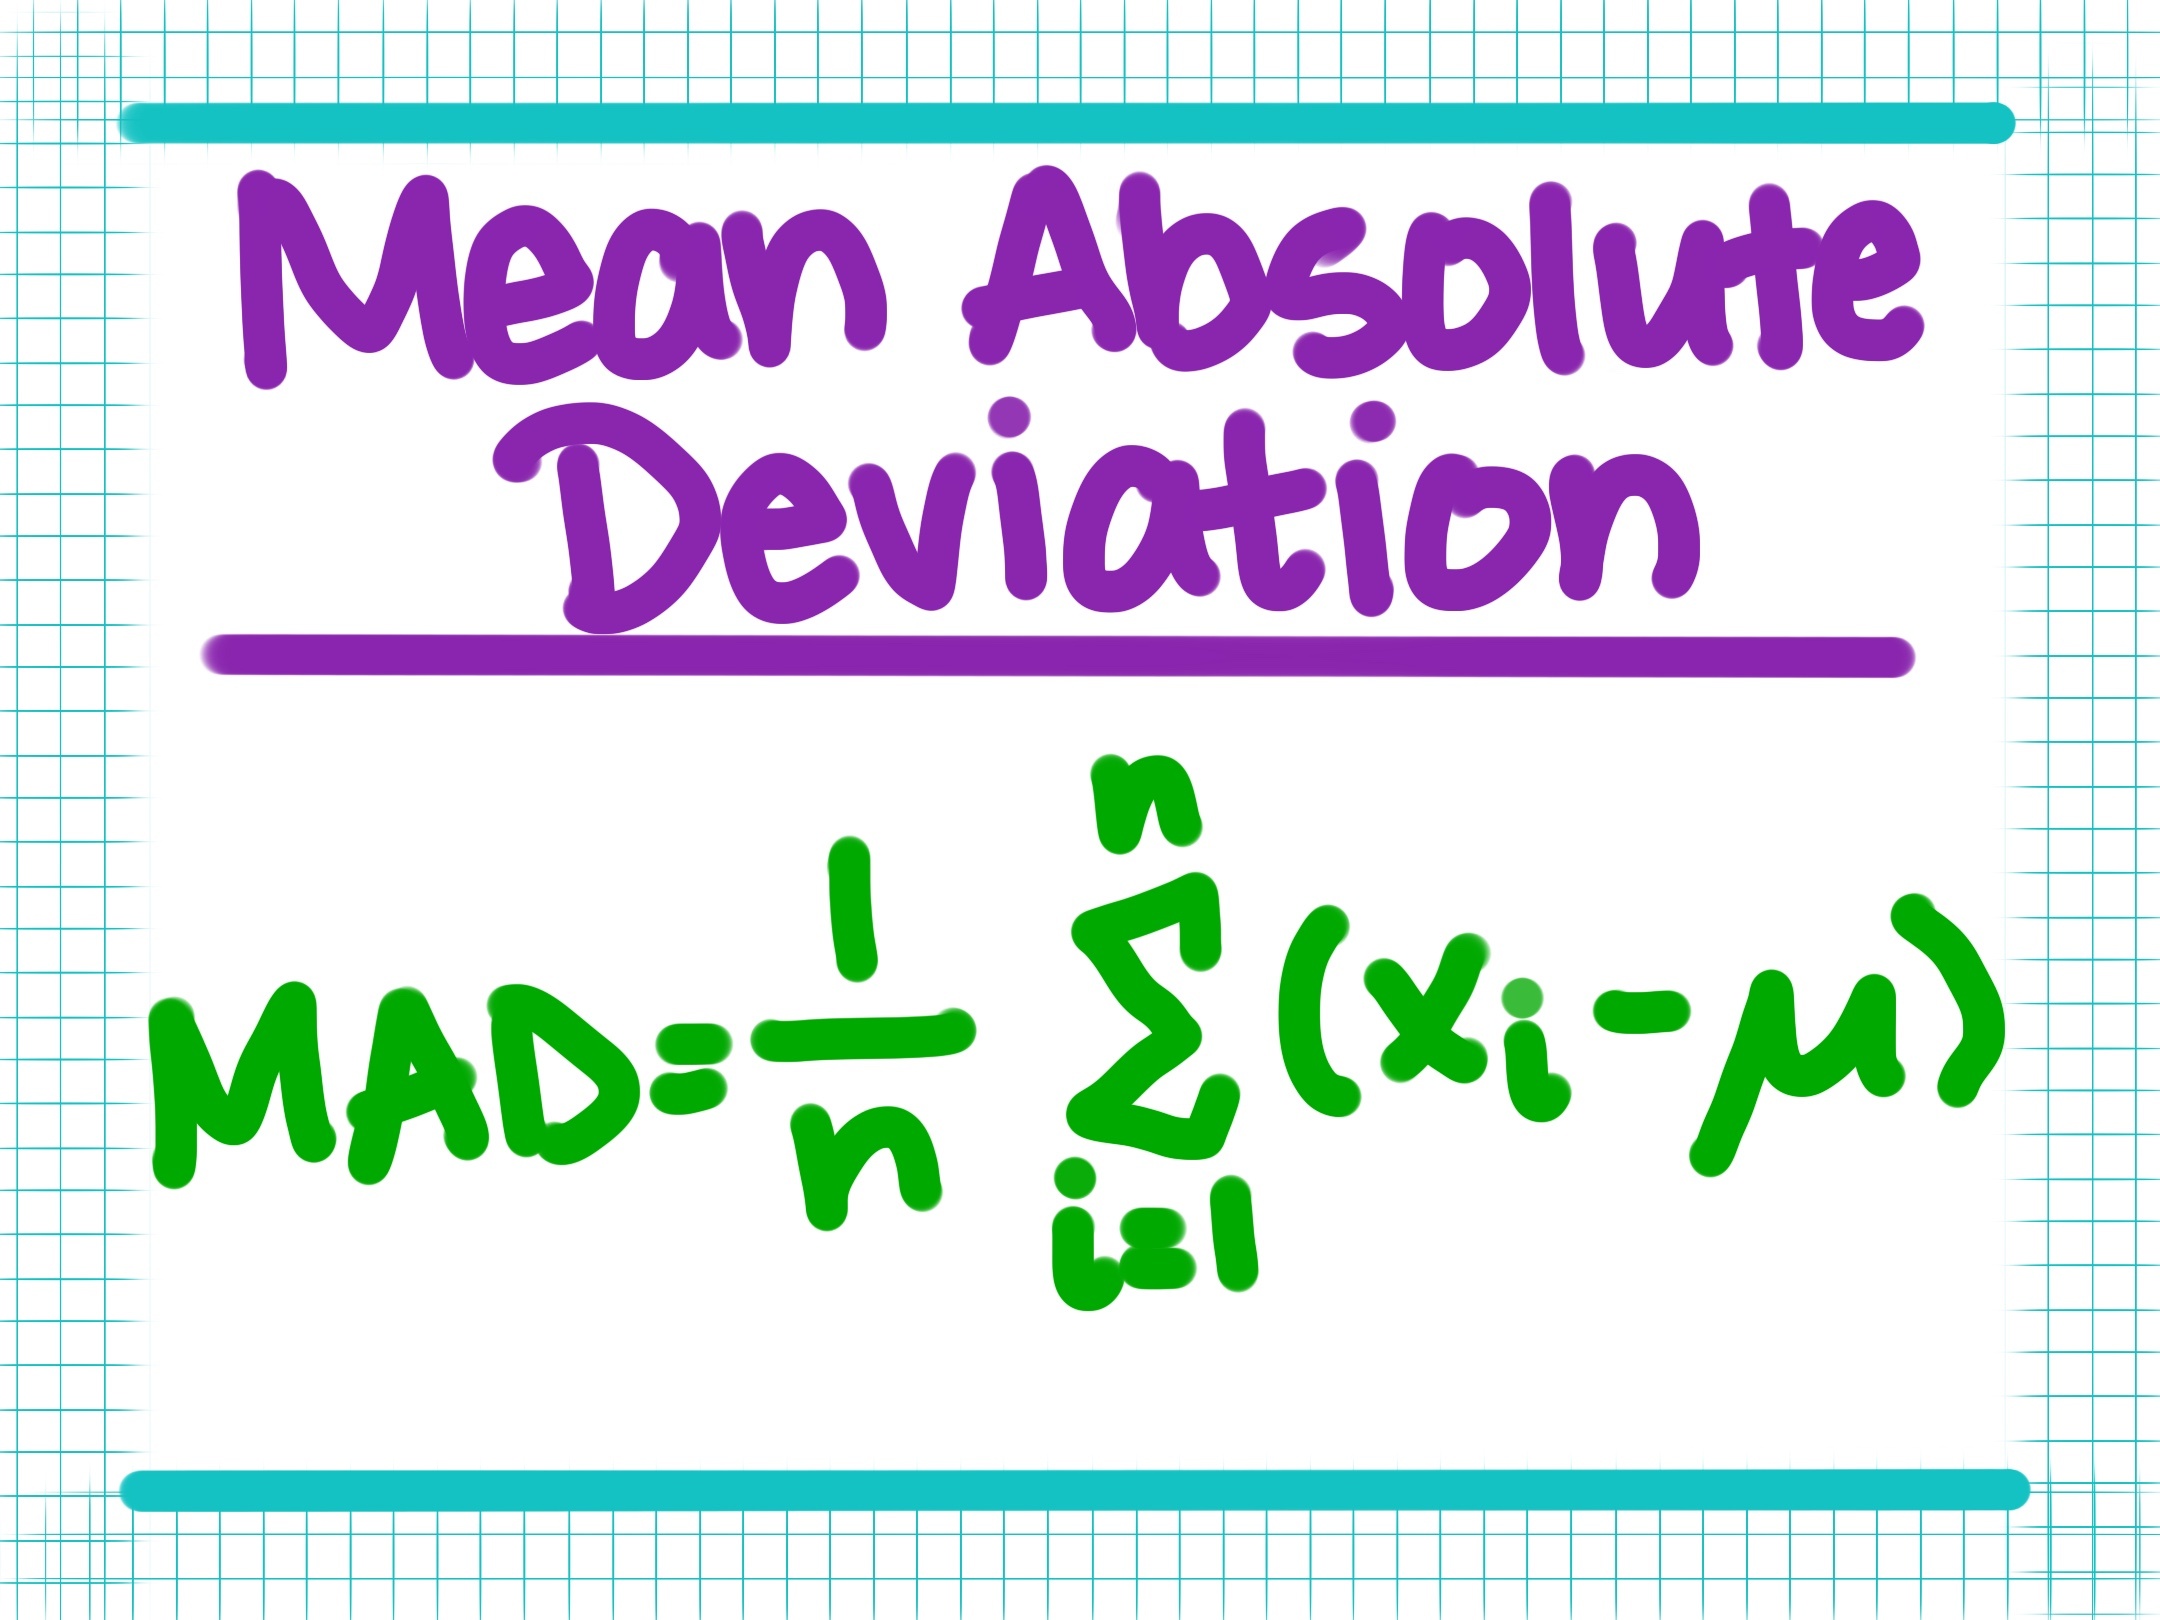
We have learned about a lot of different ways to describe variability in statistics, from standard deviation to standard error. Now we will learn about the mean absolute deviation (MAD).
##Mean absolute deviation
MAD is very similar to the standard deviation, as both look at how variable a dataset is. However, the mean absolute deviation looks at the average distance between the datapoints and the mean. Graphically, this can be seen on a number line in a dot plot.
##How to calculate the mean absolute deviation
- Calculate the average of all the datapoints.
- Take each datapoint and subtract the mean from the value. In other words, . Disregard any negative signs. These are called "deviations".
- Take the average of all these deviations.
Here is what MAD looks like in one formula:
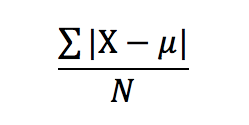
Image source: by Trisha
Looks fairly straightforward!
##Let's look at an example!
We are given a dataset of the number of seeds found in different oranges.
Dataset:
Following the steps above, we can calculate the average of the dataset.
Average = .
Next, let's take each value and subtract it from the mean. As there are so many datapoints, we'll do only a few examples.
do the same for all the datapoints!
After you have finished calculating the deviations, check your answers with ours!
Deviations:
Now, let's take the average of these deviations, which is .
Therefore, MAD = !
Exciting - now you have one more tool for a measure of variability!