Read · 2 min

Variability, Variation, and Uncertainty
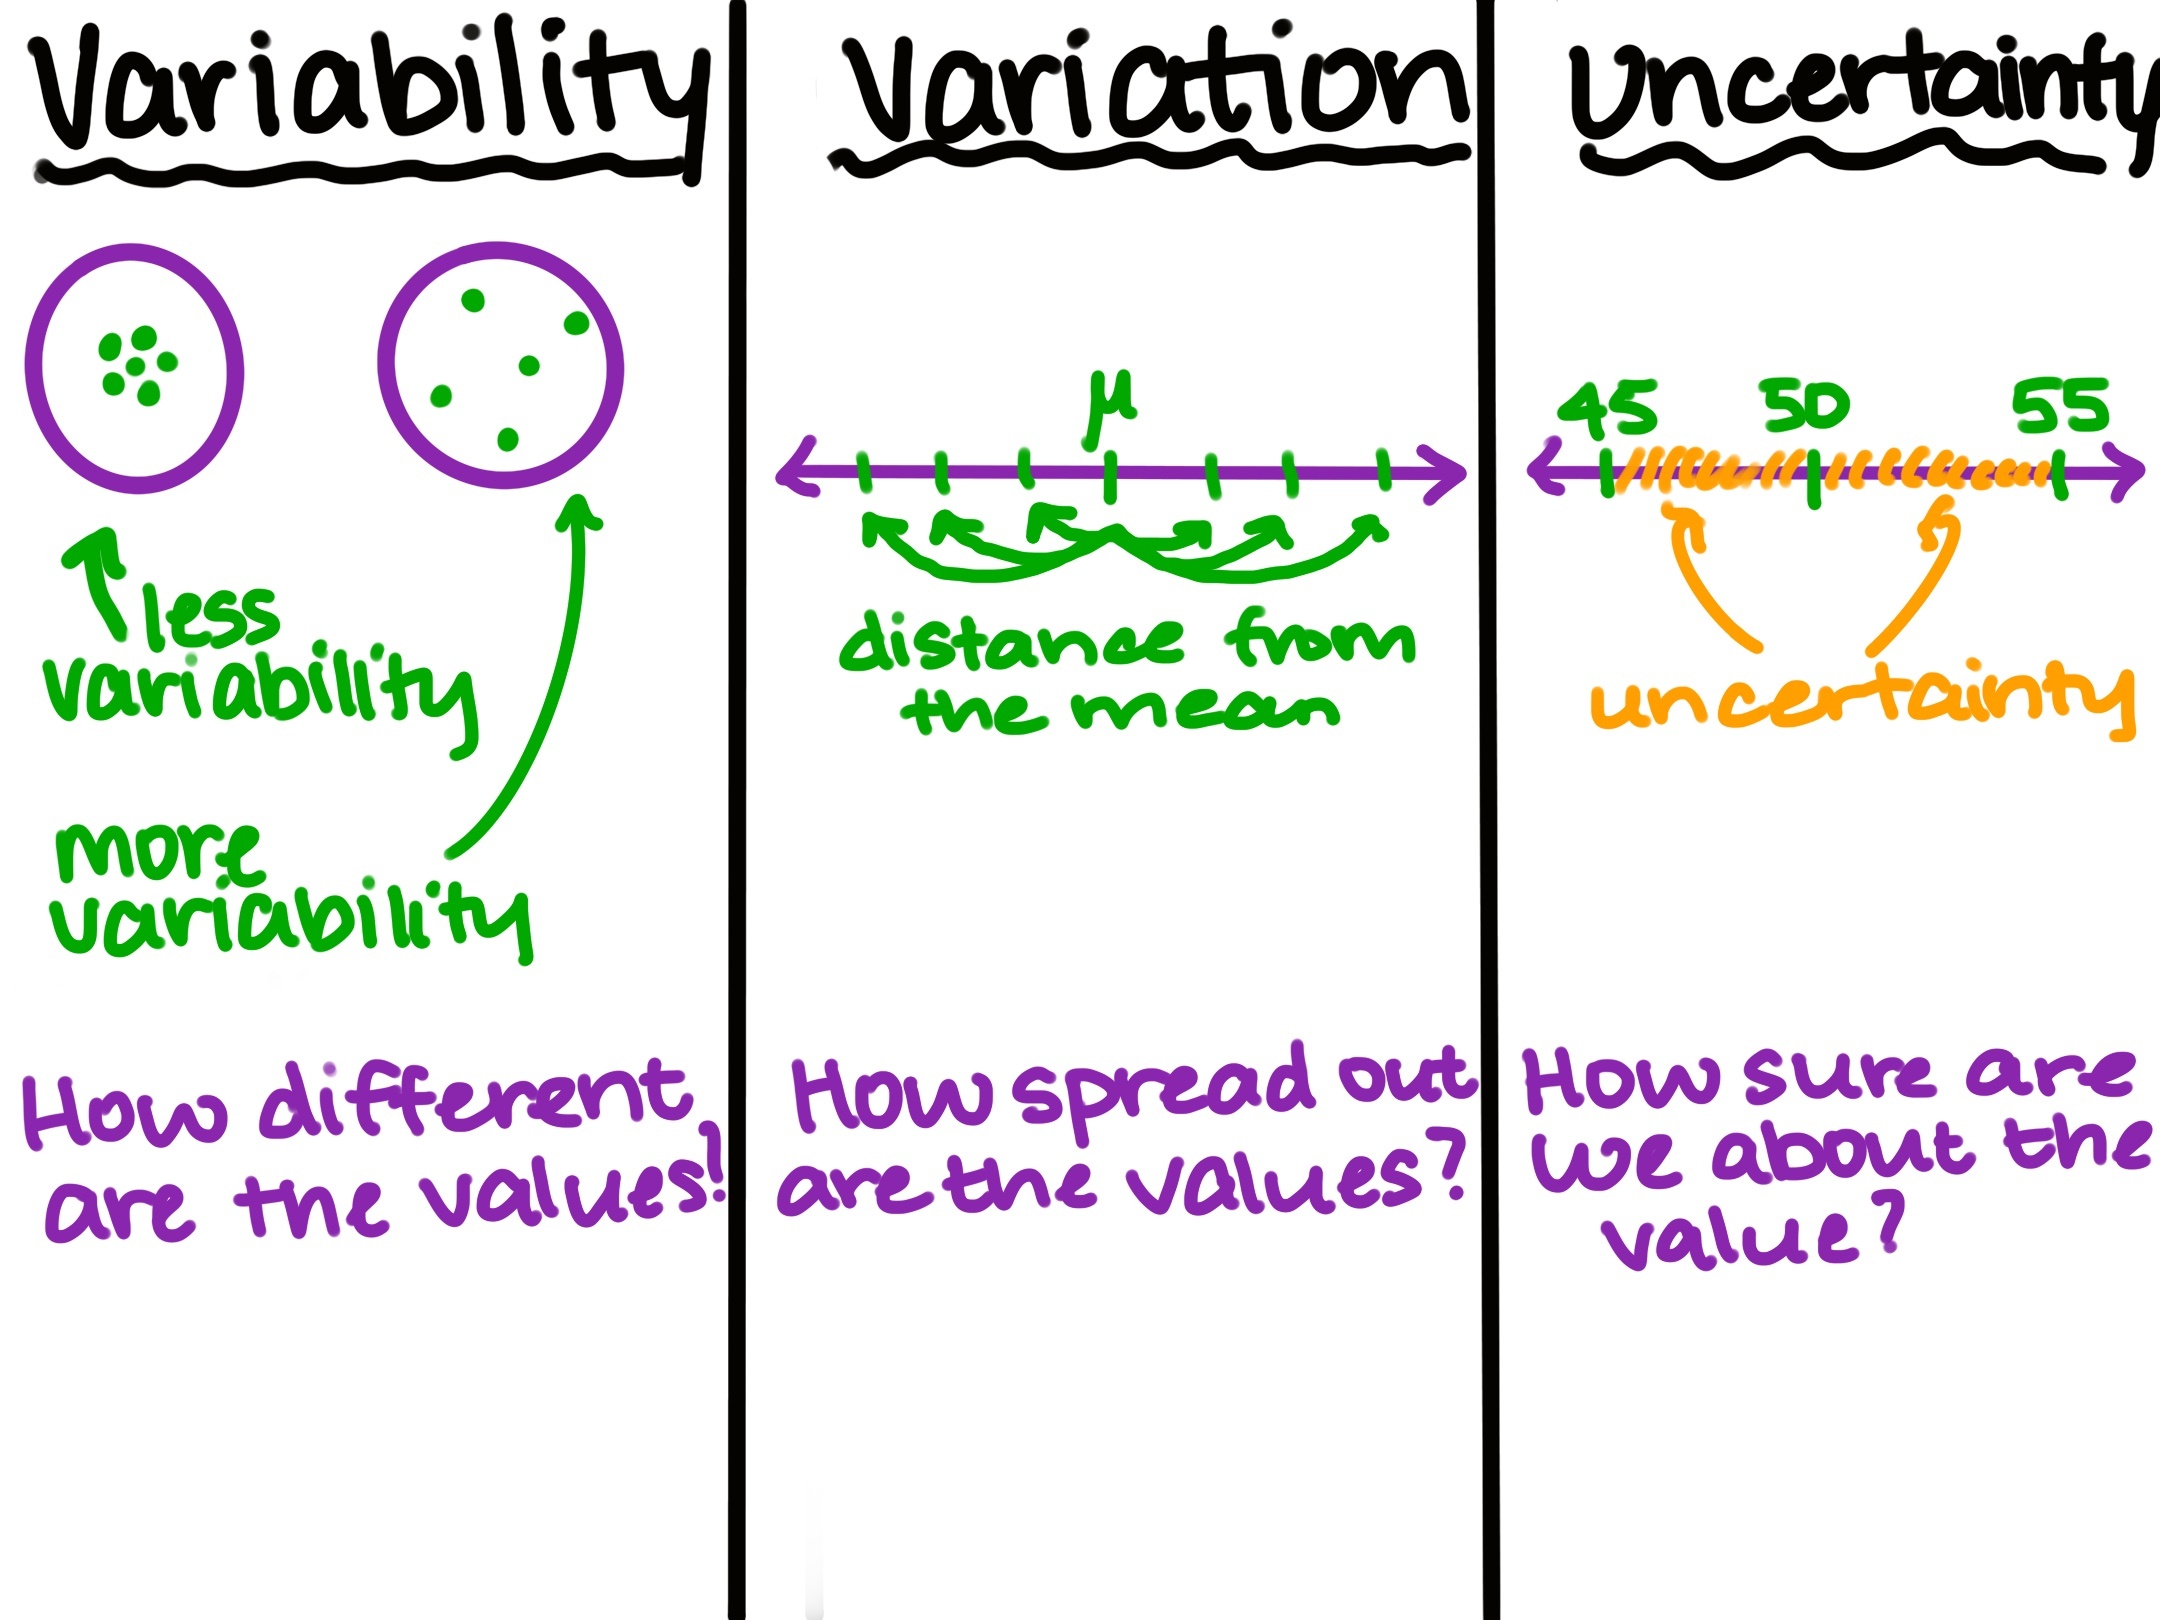
Variability describes how much the values in a data set can differ from each other. If the values are close together, there is less variability. If the values are spread out, there is more variability.
You have already learned that the mean tells us the center of a data set or random variable. However, the mean does not tell us how spread out the values are. We need another way to describe this spread. This is where variance is useful.
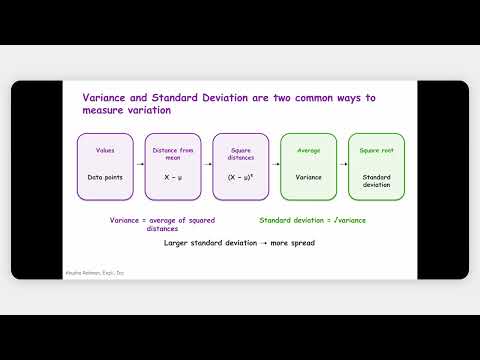
Variance measures how far values tend to be from the mean. For a random variable , the variance is written as . It can be calculated using the formula
where is the mean of . We first find the difference between each value and the mean. We then square each difference and find the expected value.
Squaring the differences is important because it makes all of them positive. A larger difference from the mean gives a larger squared value. This means that values farther from the mean have a bigger effect on the variance.
A small variance means that the values tend to stay close to the mean. A large variance means that the values are more spread out. Variance is also the second central moment of a random variable.
####Uncertainty and Standard Deviation
Variability is also connected to uncertainty. When the values of a random variable can vary a lot, it is harder to know what value we will get. When the values stay close to the mean, there is less uncertainty about the result.
The standard deviation is another way to measure variability. It is the square root of the variance. Standard deviation is often easier to understand because it uses the same units as the original data.
Understanding variability helps us learn more than just the center of a distribution. It tells us how much the values can change and how uncertain the results may be. Later, you will use variance and standard deviation to study the shape and behavior of random variables in more detail.