Interactive · 1 question
+5 contributors





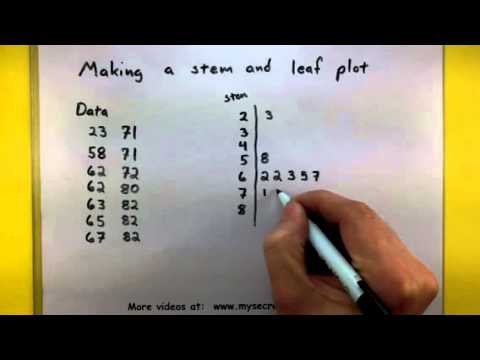
Stem and leaf plots are used to show the frequency with which certain classes of values occur. They are similar to frequency tables or histograms, and are extremely helpful in visualizing the shape of the distribution.
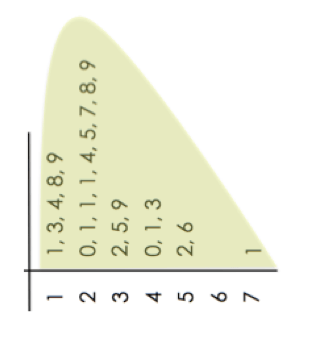
Here is an example of an empty plot:

Image source: By Catherine Yeo
For every number, the leaf is the ones digit, and is placed in the right column of the table. The stem would be the remaining digits (usually just the tens digit), and is placed in the left column of the table (in the row of its corresponding leaf).
Example
"There are students in a class. The scores of all the students on their final exams were . Make a stem and leaf plot to show the distribution of the exam scores."
First, let's sort this array of numbers in increasing order: .
What are the stems of these numbers? The stems are the leftmost digits of the data values: . (For two-digit numbers, the stems are the tens digits. Fo three digit numbers, such as the stems contain the hundreds and tens digits.)
What are the leaves for each stem? When the stem is , the leaves are and (because the scores in the range of are , , and ). When the stem is , the leaves are , and (because the scores in the range of are , , and ). When the stem is , the leaves are , and (because the scores in the range of are , , and ). When the stem is , the leaves are , and (because the scores in the range of are , , and ). When the stem is , the leaf is (because the score in the range of is ).

Image source: By Catherine Yeo
Eleven people of different ages attended Barry's birthday party. The ages were , and . How many leaves correspond to a Stem of
Solution
The leaves corresponding with a Stem of will be the values that have a as a tens digit, or the values that are in the range of If we look at our data set, we can see that the three numbers fitting that description are and