Interactive · 1 question

+1 contributors

Trend Lines
A trend line is a line added to a scatter plot that shows the generalization of all the data. Let's look at the scatter plot used in this explanation to show a trend line.
Example: Trend Line on Scatter Plot
We ask our friends their height and shoe size. The data is recorded below.

Image source: by Jonathan Heller
We're going to graph these points on a scatter plot.

Made using Desmos
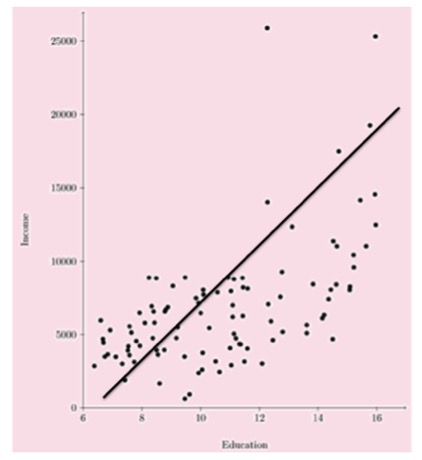
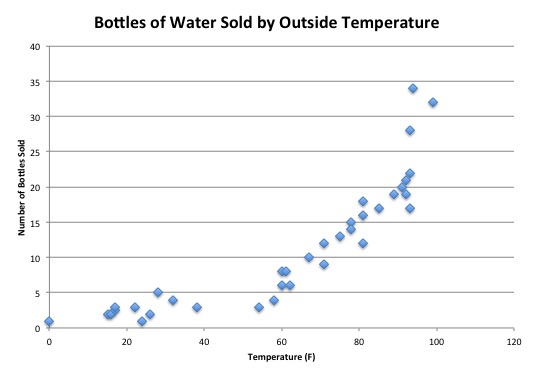
This graph has a positive correlation. The -value of each point generally increases as the -value increases. We can add a trend line to this graph by adding a line that goes through the middle of the points.

Made using Desmos
Notice that the trend line has a positive slope. This matches the positive correlation of our scatter plot.
Line of Best Fit
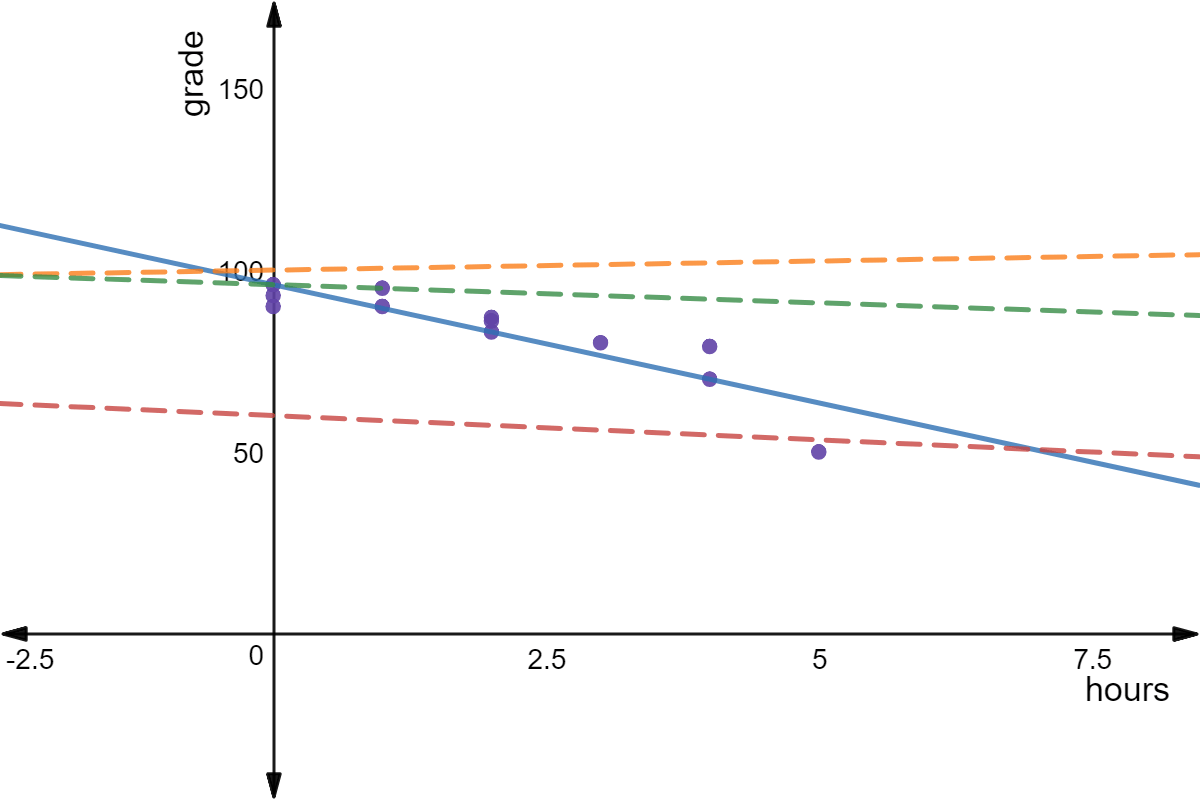
The line of best fit is the trend line that fits the data the most closely. Take a look at this scatter plot with multiple trend lines:

Made using Desmos
The dotted green and dotted red lines are also trend lines. They generally go through the middle of our data set, and they are both positively sloping to match the correlation of the data. However, the solid purple line is the line of best fit as it fits our data the best.
It can be very difficult to calculate the equation for the line of best fit, but it can be made easier using programs such as Microsoft Excel or Google Sheets.
Interpolation and Extrapolation
The line of best fit can be used for estimation. Interpolation is when we use the trend line to estimate a value that is already inside of our data set. Extrapolation is when we use a trend line to estimate a value that is outside of the range of our data set.

Made using Desmos
Let's say we wanted to estimate the shoe size of someone that is tall. is within our data set, so we can follow our line of best fit to interpolate the shoe size. At on the -axis, the -value is about , which means that we could estimate someone tall would wear size shoes.
Try one for yourself:
Extrapolate the shoe size of someone tall.
Investments
You may see these kinds of data points when you're looking at stock prices and other values when investing! Stocks can swing high and low over a time frame, and you may need to draw a line of best fit to figure out whether the price is steadily increasing or decreasing. One think you'll notice with this real-world example is that you may have a bunch of data points underneath the line or on top of the line. This is called support or resistance.
If a bunch of points are on top of the line, then the line acts as support. If there are a bunch of points under the line, then the line acts as resistance. With rapidly changing stock prices, you'll see trend line breaks, where the line suddenly changes direction.