Video
By Alex Federspiel

+1 contributors
Contributors

(Video) Graph a Circle
by mathman1024

Here's a video by mathman1024 showing you how to graph a circle using the center and radius. Remember that the center-radius form for a circle is: Where the center is the point and the radius is .
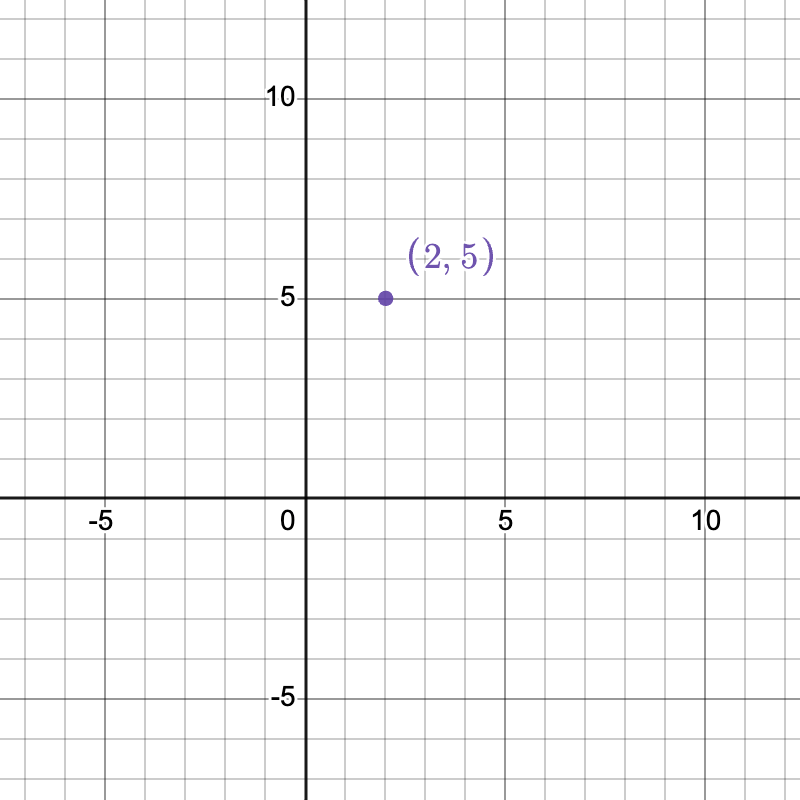
The example he looks at is: . We know the center is the opposite signs of the numbers in the equation, so: . So let's plot this point!
Created via Desmos
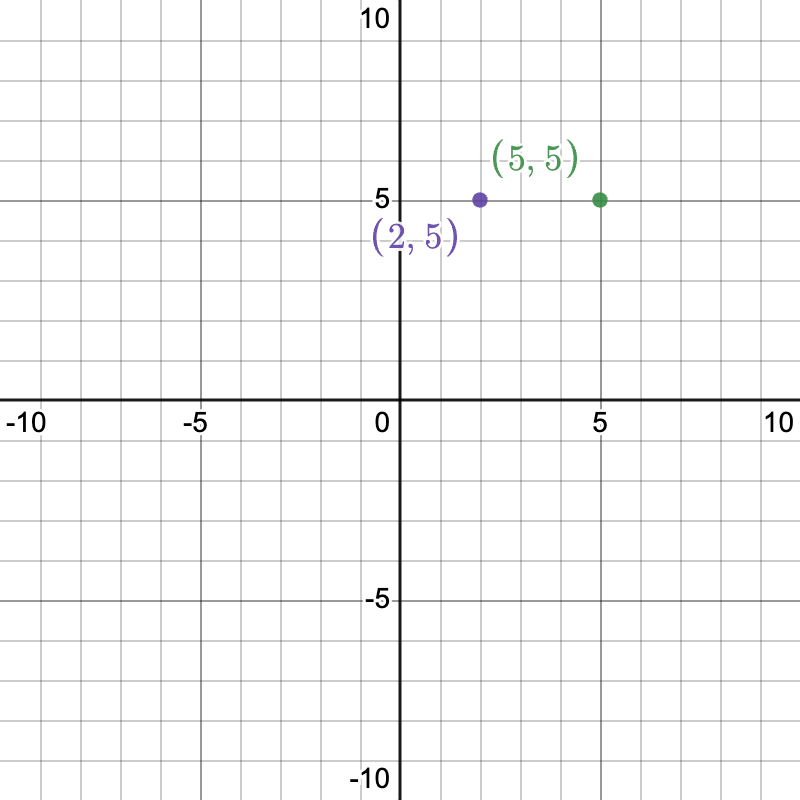
Now we know the radius is the square root of the number on the end. So: . So now we plot a point that's units away from the center in each direction: north, south, east, and west.
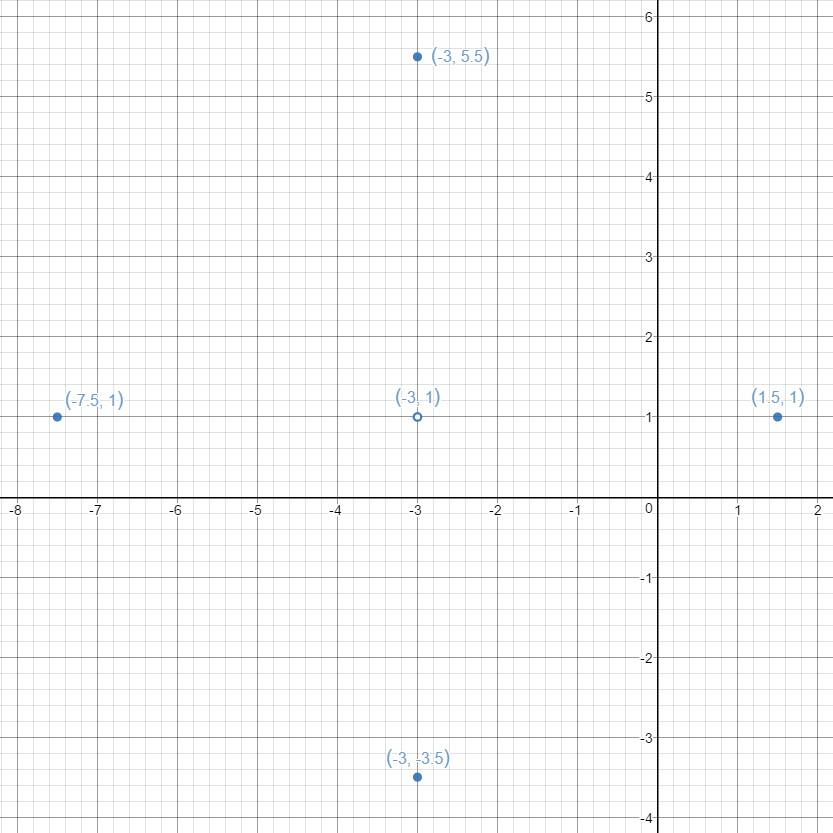
Created via Desmos
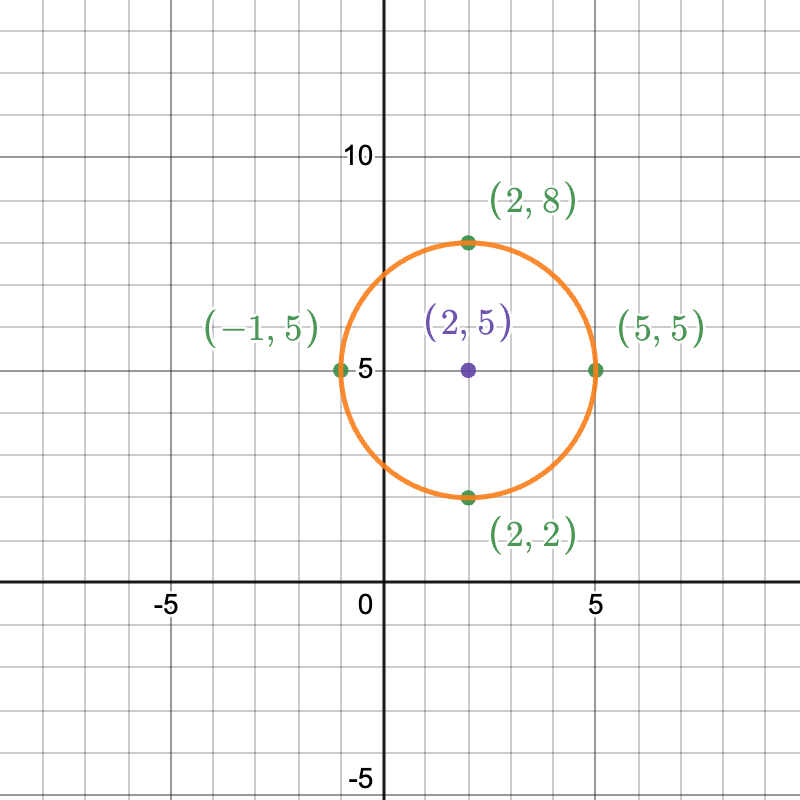
Now that we have the outline we just need to make a circle around these outer points!

Created via Desmos
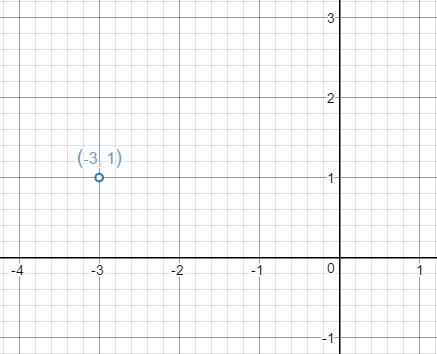
Test Yourself: Graph the circle .
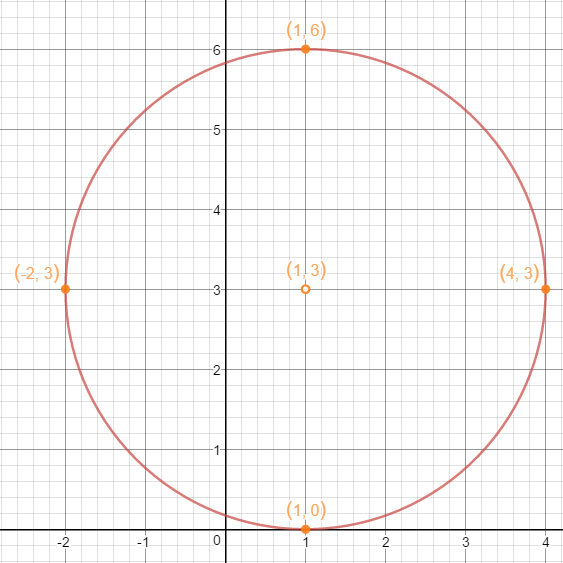
Created via Desmos