Venn Diagram - Definition & Examples

Before this, knowUnion of Sets - Definition & ExamplesIntersection of Sets - Definition & Examples

Illustrated · 2 min

Using Venn Diagrams to Solve Word Problems

So how do we use these diagrams to solve word problems? Let's work through a few example problems that are similar to ones you may encounter.

Example 1

There are 1,0001{,}000 students in a high school. 800800 students enjoy learning about English, 700700 students enjoy learning about History, and 500500 students enjoy learning about both History and English. How many students enjoy learning about English but not History? How many students do not like English nor History?

Let's draw a diagram to figure it out:

Venn Diagram of the scenario

Image source: by Caroline Kulczycky

Here, we let the variables E,B,E,B, and HH represent amounts of students:

  • E=E= number of students who only enjoy English
  • B=B= number of students who only enjoy both English and History
  • H=H= number of students who only enjoy History

First let's figure out how many students only enjoy English. In other words, let's calculate EE.

We know that 800800 students in total enjoy English. That means: E+B=800E+B=800

We also know that 500500 students enjoy both English and History, i.e., B=500B=500. Now, we can substitute B=500B=500 into our E+B=800E+B=800 equation: E+B=800E+500=800E+500 − 500=800 − 500E=300\begin{align} E+B&=800\\ E+\color{#8925AE}{500}&=800\\ E+500\,\color{#8925AE}{-\,500}&=800\,\color{#8925AE}{-\,500}\\ E&=300 \end{align} So, E=E= number students who only enjoy English =300=300.

Same Venn diagram, but noting that E=300.

Image source: by Caroline Kulczycky

Next, let's figure out how many students only enjoy History, or H.H.

We can calculate HH the same way we calculated E.E. We know that 700700 students in total enjoy History. That means: H+B=700H+B=700

We also know that 500500 students enjoy both English and History, i.e., B=500.B=500. Now, we can substitute B=500B=500 into our H+B=700H+B=700 equation: H+B=700H+500=700H+500 − 500=700 − 500H=200\begin{align} H+B&=700\\ H+\color{#8925AE}{500}&=700\\ H+500\,\color{#8925AE}{-\,500}&=700\,\color{#8925AE}{-\,500}\\ H&=200 \end{align} So, H=H= number of students who only enjoy History =200=200.

Let's fill in the diagram with this new information, just for kicks!

Same Venn diagram, but also noting that H=200.

Image source: by Hannah Bonville

Example 2

Out of the 200200 seniors at your local high school, 180180 of them take Opera Singing and 3030 of them take Speedcubing. Students must take either Opera Singing, Speedcubing, or both. How many students take both classes?

Again, let's make a Venn diagram to model the situation.

Venn Diagram describing the situation.

Image source: by Caroline Kulczycky

Notice that if we add the number of students taking Opera Singing and the number of students taking Speedcubing, we get 180+30=210180+30=210 But 210210 is 1010 greater than the total number of seniors, which is 200.200. This means that 1010 students must take Opera Singing and Speedcubing.

Example 3

Challenge Problem: Sets AA and BB have the same number of elements. If their union has 4,0004{,}000 elements and their intersection has 1,0001{,}000 elements, how many elements are in the set AA?

Time to draw a Venn diagram!

Venn diagram of the situation

Image source: by Caroline Kulczycky

Here, we let the variables a,b,a,b, and cc represent how many elements are in their respective sections of the Venn diagram:

  • a=a= number of elements in only AA
  • b=b= number of elements only in BB
  • c=c= number of elements in both AA and BB

The number of elements in the union of the sets (A∪B)(A \cup B) is represented by a+b+c.a+b+c.

The number of elements in the intersection of the sets (A∩B)(A \cap B) is represented by c.c.

In the problem, we are given: a+b+c=4,000c=1,000\begin{align} a+b+c&=4{,}000\\ c&=1{,}000 \end{align}

Let's plug in c=1,000c=1{,}000 into our a+b+c=4,000a+b+c=4{,}000 equation! a+b+c=4,000a+b+1,000=4,000a+b+1,000 − 1,000=4,000 − 1,000a+b=3,000\begin{align} a+b+c&=4{,}000\\ a+b+\color{#8925AE}{1{,}000}&=4{,}000\\ a+b+1{,}000\,\color{#8925AE}{-\,1{,}000}&=4{,}000\,\color{#8925AE}{-\,1{,}000}\\ a+b&=3{,}000 \end{align} So, now we know that a+b=3,000.a+b=3{,}000.

The problem also tells us that sets AA and BB have the same number of elements. This means that a+c=b+c.a+c=b+c. We can simplify this equation by subtracting cc from both sides: a+c=b+ca+c − c=b+c − ca=b\begin{align} a+c&=b+c\\ a+c\,\color{#8925AE}{-\,c}&=b+c\,\color{#8925AE}{-\,c}\\ a&=b \end{align}

Since a=b,a=b, we can plug aa in for bb in our a+b=3,000a+b=3{,}000 equation: a+b=3,000a+a=3,0002a=3,0002a2=3,0002a=1,500\begin{align} a+b&=3{,}000\\ a+\color{#8925AE}{a}&=3{,}000\\ 2a&=3{,}000\\ \frac{2a}{\color{#8925AE}{2}}&=\frac{3{,}000}{\color{#8925AE}{2}}\\ a&=1{,}500 \end{align} So, now we know that a=1,500a=1{,}500 and we were given that c=1,000.c=1{,}000. Since the number of elements in set AA is equal to a+c,a+c, we can calculate that the total number of elements in set AA is: A=a+cA=1,500+1,000A=2,500\begin{align} A&= a+c\\ A&=1{,}500+1{,}000\\ A&=2{,}500 \end{align}

Worth the struggle

Twenty minutes on one hard problem can teach more than ten easy exercises. These problems are worth staying with. These are real problems from the AMC 8, AMC 10, AMC 12 and AIME, the national math competitions for middle and high school students, each with a worked solution on LIVE by Po-Shen Loh.

Interactive · 6 questions

Using Venn Diagrams to Show Union and Intersection

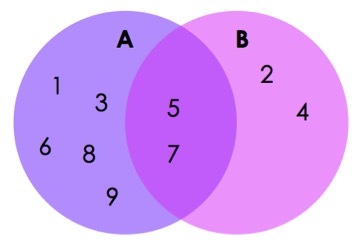
A great way to visualize sets is through the use of Venn diagrams. Also known as Euler diagrams, John Venn created these types of diagrams to help visualize set theory. These are essentially overlapping Eulerian circles to show what two subsets in common. We saw similar diagrams when we were looking at subsets and complements.

You've probably seen one of these before. Check it out:

Stuff unique to this left circle // Stuff shared // Stuff unique to this circle

Image source: by Hannah Bonville

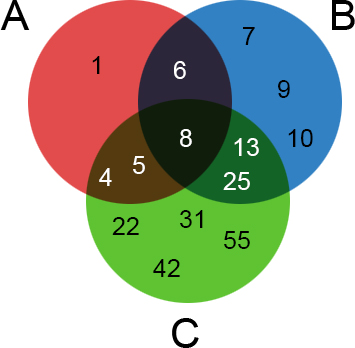
Here is another example. We have stuff that is unique to A,BA, B, and CC, as well as things that are shared by AA and B,AB, A and CC, BB and CC, and all 33 (A,B,A, B, and CC).

Three circles overlapping.

Image source: by Hannah Bonville

Favorite foods of 2nd graders: pudding, applesauce, yogurt, pizza, ice cream
Favorite foods of 8th graders: bread, chips, french fries, chicken, pizza, ice cream
Favorite foods of both: pizza, ice cream

Image source: by Hannah Bonville

Let's try reading some Venn diagrams. Check off all of the foods that are favorites among 22nd graders.

Choose all correct answers

Video

(Video) Venn Diagrams: Shading Regions for Two Sets

by PatrickJMT

This video by PatrickJMT demonstrates how to use Venn diagrams to represent different set interactions, including intersections and unions.

Summary\large{\text{Summary}}

Definitions

When shading, there are three main cases: unions, intersections, and complements (everything but the indicated set).

Venn diagram for unions, intersections, and complements.

Image source: by Stefan Cuevas

Example 1

What does the Venn diagram look like for A∪B ′A\cup B\,'.

The best way is to go one step at a time. First, draw AA.

Venn diagram of A.

Image source: by Stefan Cuevas

Next, we draw B ′B\,'.

Venn diagram of B'.

Image source: by Stefan Cuevas

Finally, we find their union, A∪B ′A\cup B\,'.

Venn diagram of A union B'.

Image source: by Stefan Cuevas

Illustrated · 1 min

A Venn diagram shows all the possible logical relations between a finite collection of sets where a set is a collection of distinct objects.

∪\cup is read as "union" and ∩\cap is read as "intersection"

Let AA and BB be sets. Then A∪BA \cup B is the set of all the elements in AA and BB. A∩BA\cap B is the set of all the elements that belong to both AA and BB.

Example:

P={5,17,25,28,0,2,10}Q={0,2,10,7,6,9,4,11,12,8}\begin{align} P &= \{5, 17, 25, 28, 0, 2, 10\}\\ Q &= \{0, 2, 10, 7, 6, 9, 4, 11, 12, 8\} \end{align}

This is the union of PP and QQ. P∪Q={5,17,25,28,0,2,10,7,6,9,4,11,12,8}P \cup Q = \{5, 17, 25, 28, 0, 2, 10, 7, 6, 9, 4, 11, 12, 8\} It includes all the elements in both sets, but only one of each (notice that there aren't two 2020's or 00's in the set).

This is the intersection of PP and QQ. P∩Q={0,2,10}P\cap Q = \{0, 2, 10\} It includes only the elements that are in both of PP and QQ, and nothing else.

The Venn diagram for the two sets is below:

P: 5, 25, 17, 28, 0, 2, 10
Q: 7, 9, 4, 8, 11, 6, 12, 0, 2, 10
P and Q: 0, 2, 10

Image source: by Vinitha Ranganeni

Try it yourself!

Look at the following information, then draw a Venn diagram. Notice that we're working with three sets, rather than just two, so you'll need three circles.

A={1,4,5,6,8}B={6,7,8,9,10,13,25}C={4,5,8,13,22,25,31,42,55} A∪B={1,4,5,6,7,8,9,10,13,25}A∪C={1,4,5,6,8,13,22,25,31,42,55}B∪C={6,7,8,9,10,13,25,4,5,22,31,42,55} A∩B={6,8}A∩C={4,5,8}B∩C={8,13,25}\begin{align} A &= \{1, 4, 5, 6, 8\}\\ B &= \{6, 7, 8, 9, 10, 13, 25\}\\ C &= \{4, 5, 8, 13, 22, 25, 31, 42, 55\}\\\ \\ A \cup B &= \{1, 4, 5, 6, 7, 8, 9, 10, 13, 25\}\\ A \cup C &= \{1, 4, 5, 6, 8, 13, 22, 25, 31, 42, 55\}\\ B \cup C &= \{6, 7, 8, 9, 10, 13, 25, 4, 5, 22, 31, 42, 55\}\\\ \\ A \cap B &= \{6, 8\}\\ A \cap C &= \{4, 5, 8\}\\ B \cap C &= \{8, 13, 25\} \end{align}
Venn diagram of above.

Image source: by Vinitha Ranganeni

Type a concept, like “slope” or “photosynthesis”.

↑ ↓ to choose · Enter to openSearch explanations and problems