Illustrated · 2 min

+1 contributors

Log scale: intuition
Now that we're familiar with writing exponential equations, let's take this concept a step further!
We're used to seeing number lines spaced apart by integer increments; one space from to illustrates , three spaces from to represents , and so on. In general, our usual number line visually represents that spaces between the numbers and is an equivalent statement to . If the spaces have length (instead of ), this becomes .
If we have data that covers a set of values that are all close together, the number line - or, linear scale - can handle it. Most graphs we initially learn about simply compare two linearly scaled pieces of information:
The line (also written and called the identity function) takes in numbers and maps them to themselves.

We can see that both axes are number lines.
This graph of the unusual correlation (potential relationship) between cheese and civil engineering also uses a linear scale.
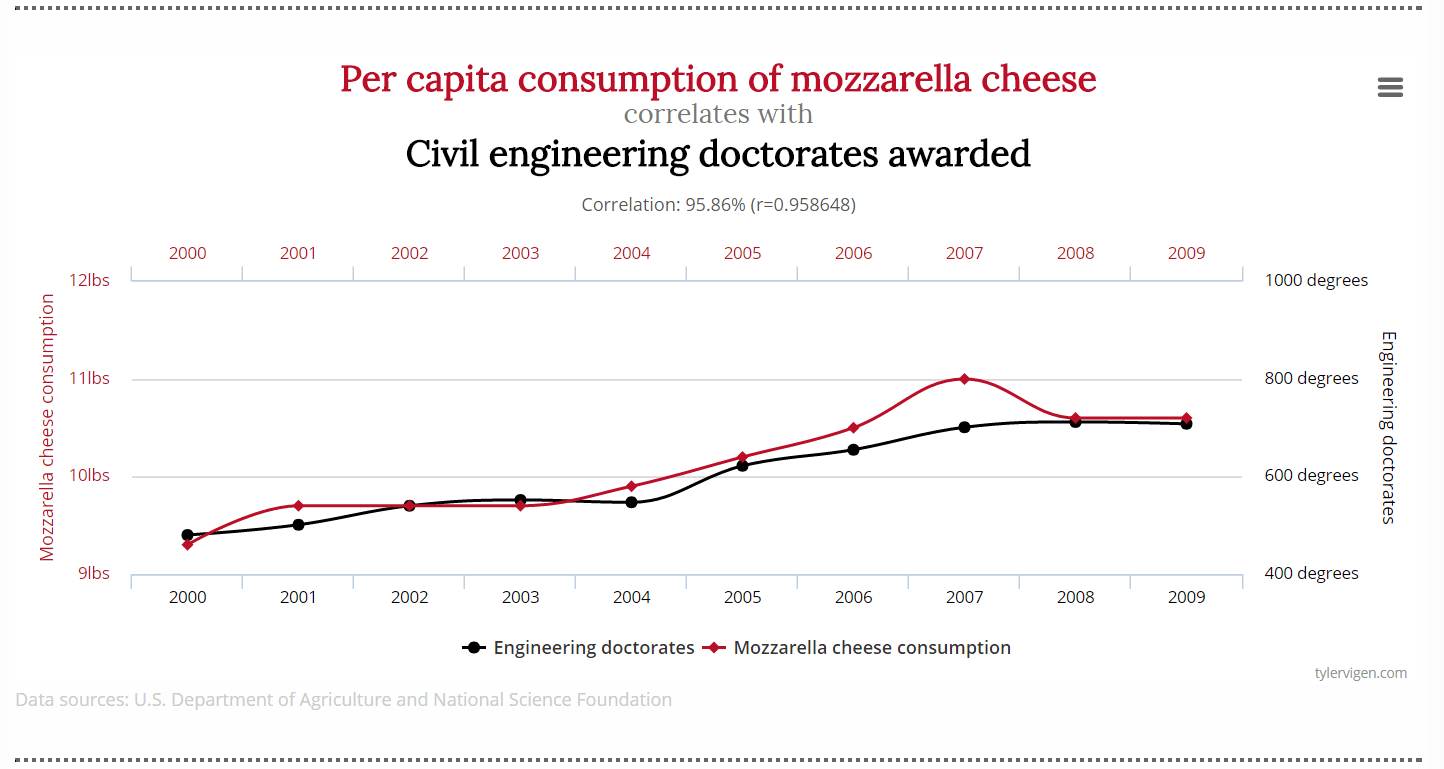
We can see here that the difference between any two points on any axis is the same along that axis.
Let's think about what happens when some information we want to look at covers a large range of values!
One possibility is the logarithmic scale; instead of incrementing values by (or by multiples of ), it uses the powers of a number. A number line with a log scale could use powers of , for example, where a value would be , then , then , and so on. Negative exponents of would be used to represent fractions.
On this new line, we see that a space between two values means that we multiply the earlier one by to get to the later one; three spaces between and means that is a thousand () times larger than !
While is a common base for the log scale, any number would work. In the general case, spaces between and with a base is an equivalent statement to .
This is extremely useful for graphing large data ranges. The decibel (dB), the measurement for sound, is actually logarithmic, which is why increasing sounds by a dB can be the difference between a normal conversation ( dB) and a jackhammer ( dB)!
In this graph, there are so many different values to be represented that they are split up by powers of :

While this is not a typical graph, we can see the benefit of the log scale.
Log graphs can also be useful to find relationships between data that linear graphs could not communicate easily:

The plotted points remain unchanged; only the vertical axis is adjusted.
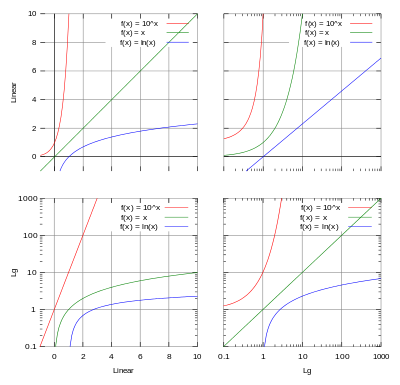
The above graphs show what happens when one axis uses a linear scale and the other a logarithmic one; there are, however, graphs where both axes are logarithmic (just as there are graphs where both axes are linear). This comparison of three functions where only the axes change demonstrates how the same data can be represented differently by changing the scale:

Check out the logarithmic graphing section here to learn how to graph these on your own!