Illustrated · 3 min
+1 contributors

Statistics is the art of using knowledge that we're absolutely sure of to make very good guesses about things which we don't know. When something is Statistically Significant, it is so unlikely that it might as well be impossible, or it is so likely that it is practically certain - depending on how you construct your tests.
Let's say that you're talking to your friends after a really hard test, and you want to figure out whether you did better or worse than the rest of your class, on average. In theory, you could find this out by just asking everybody about their score - you could then sum up all the scores and divide by the number of your classmates to get the answer. But there will almost certainly be people who either aren't there or won't tell you - and the teacher is being tight-lipped too. Because of this, you can't know the true average score of the class. You'll need to do a statistical test.
So, you average your friends' scores and you think that the scores in the class are centered around one value with outliers on both sides. A t-test is the perfect choice, and you do the test, setting your hypothesis to be:
and your alternative to be
In other words, you are assuming for the moment that your score is at the mean value, while checking whether it is reasonable that the mean is in fact lower than your score.
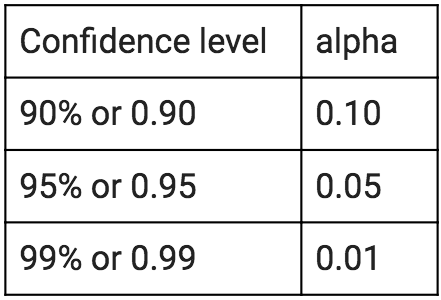
You set your , which means that you want there to be a less than 5% chance of the t-test being wrong in order to declare that you have done better than the class average.
You do the test, and your p-value comes out to be .
This graph is of the number of people with a score, which implies the probability of getting that score.

Image source: by Tom Vielott
Your score is beyond the point at which there is a 5% chance of a score that high or higher will occur.
Hooray! Your test is statistically significant!
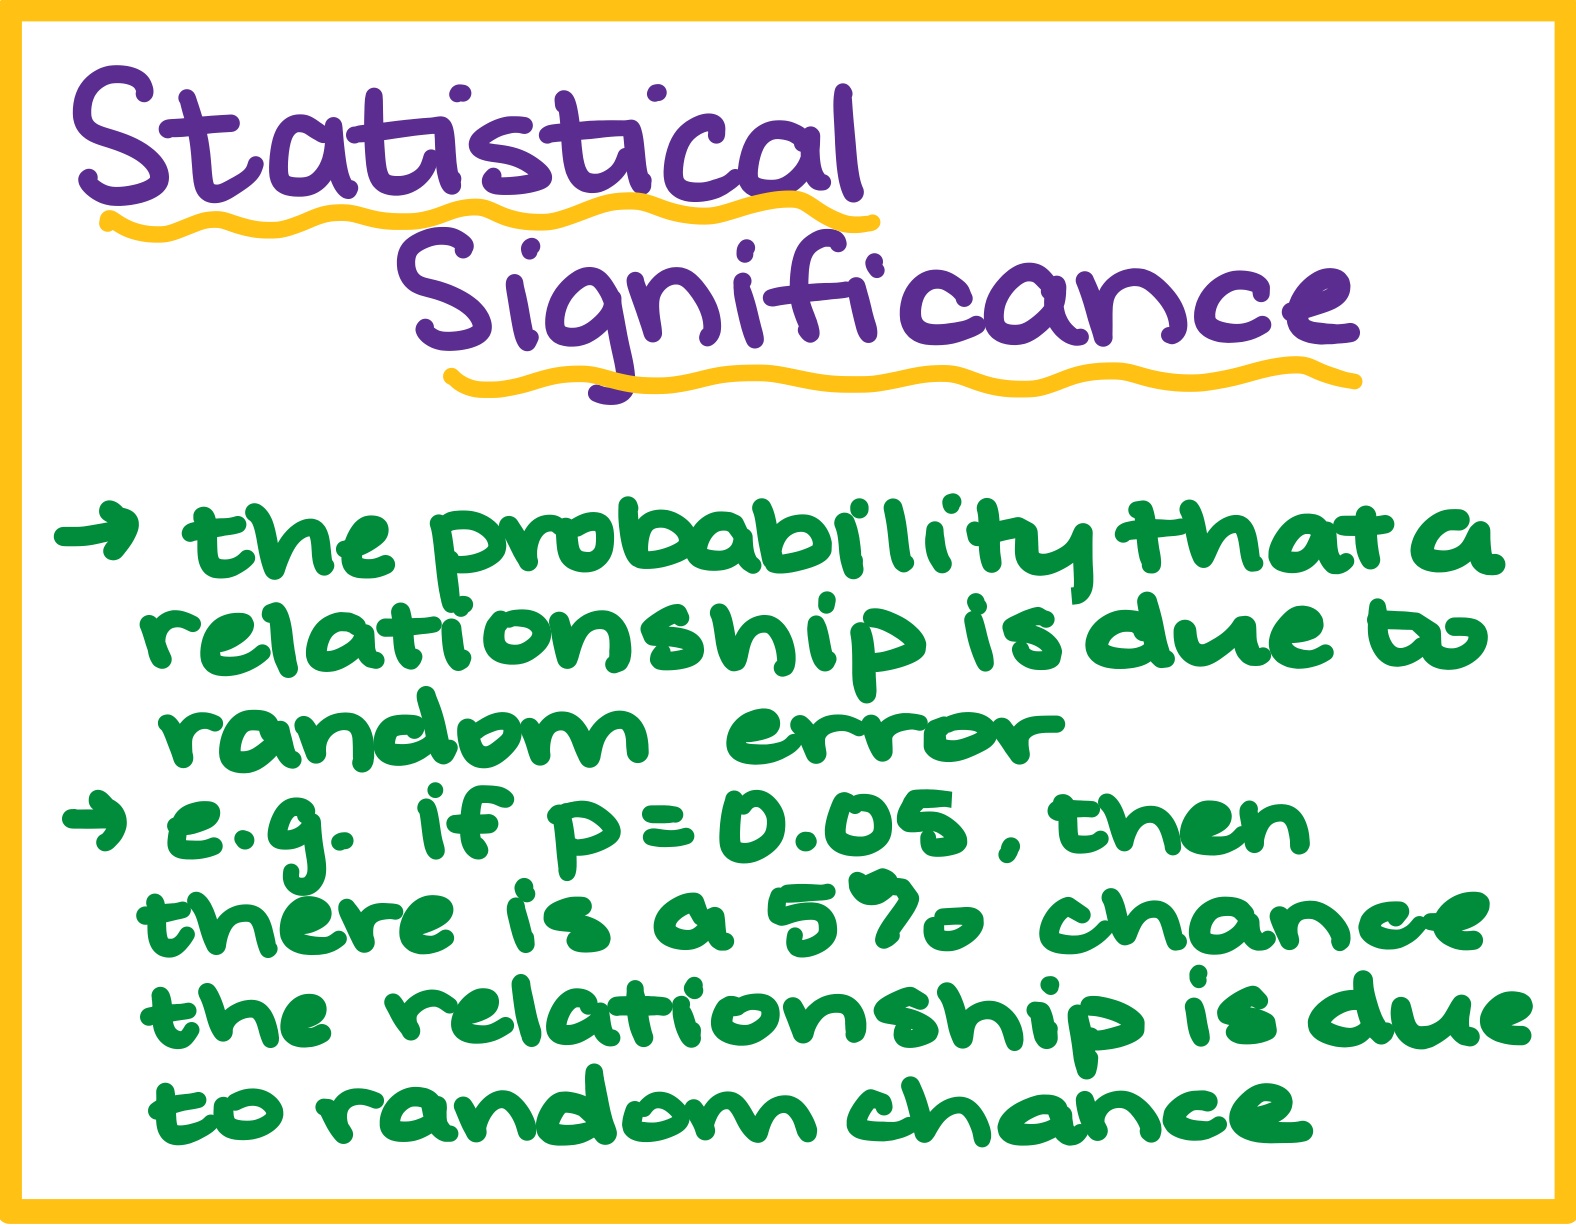
"Statistically significant" is really just another term for "pretty likely" or, in this case, "pretty unlikely." Your p-value is the probability that you got the results that you did or worse, assuming the null hypothesis is correct. So, there is a 0.1% chance that your test score would be in this high if it were the class mean. Given this, we can be confident in the alternative hypothesis - the class mean grade is very likely to be lower than your grade.
Had you gotten a p-value of .98, for example, you could be pretty confident that your test score is very close to the class mean and not substantially different from it. (98% confident, in fact).
Warning
You must always be careful about "Statistically Significant" results, as they are often less broad than they are stated to be. For example, the result above is dependent on the assumption that the class scores had a roughly bell curved shape. What if the real distribution of scores was not a bell curve, but shaped like this:
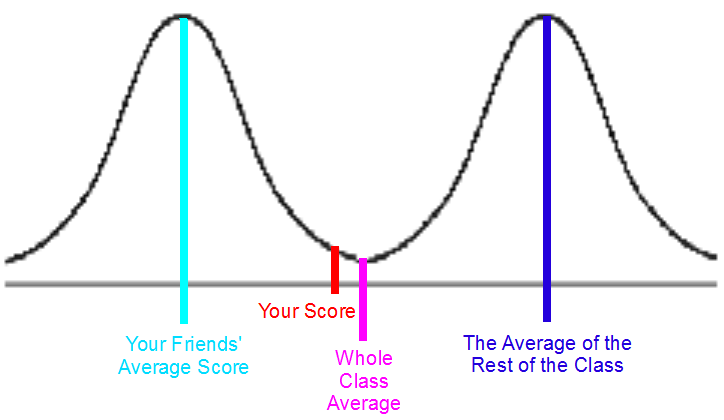
Image source: by Tom Vielott
Then your test would tell you that you were pretty far ahead of the mean, despite the fact that your score is below it.
Your assumptions must match the truth in order to produce true results. Far worse things can come about than unjustified pride when a professional statistician gets it wrong.
Always think about the assumptions of a study when evaluating its worth. After all, it is possible play with your assumptions to make your data seem significant. If one blindly accepts significance as a sign of truth, one can be manipulated into believing entirely contradictiory things. Many scientists fall into this trap because they need to have "significant" results to be published and get more funds to continue their work.
Try it out yourself with some data about Politics and the US Economy