Read · 3 min

How To Calculate A Confidence Interval (CI)

Depending on our sample size, our confidence interval formula will depend on values from either our Z-table or T-table.

Additionally, our CI formulas will change slightly based on whether or not our parameter of interest is either a mean or a proportion, or if we are comparing one-sample or two-samples.

In general, if you do not know the population standard deviation, you will use a t-score. It gets a little more complicated if you do know the population standard deviation, then it gets a little more complicated.

Know population standard deviation→sample size > 30→z-score\text{Know population standard deviation} \rightarrow \text{sample size > 30} \rightarrow \text{z-score} Know population standard deviation→sample size < 30→t-score\text{Know population standard deviation} \rightarrow \text{sample size < 30} \rightarrow \text{t-score}

Online, you will find a lot of awesome z-score tables and t-score tables.


Z-table Confidence Interval Formulas:

  • one-sample mean z-table CI formula: xˉ±Z∗⋅(σn)\bar{x} \pm Z^* \cdot (\frac{\sigma}{\sqrt{n}})

  • one-sample proportion z-table CI formula: p^±Z∗⋅p^(1−p^)n\hat{p} \pm Z^* \cdot \sqrt{\frac{\hat{p}(1-\hat{p})}{n}}

  • two-sample mean z-table CI formula: (x1ˉ−x2ˉ)±Z∗⋅σ12n1+σ22n2(\bar{x_1} - \bar{x_2}) \pm Z^* \cdot \sqrt{\frac{\sigma_1^2}{n_1} + \frac{\sigma_2^2}{n_2}}

  • two-sample proportion z-table CI formula: p1^−p2^±Z∗⋅p1^(1−p1^)n1+p2^(1−p2^)n2\hat{p_1} - \hat{p_2} \pm Z^* \cdot \sqrt{\frac{\hat{p_1}(1-\hat{p_1})}{n_1} + \frac{\hat{p_2}(1-\hat{p_2})}{n_2}}


t-table Confidence Interval Formulas:

Search t-table with confidence level and degrees of freedom (dfdf)

df=n−1df = n - 1 for a one-sample problem

or

df=n1+n2−2df = n_1 + n_2 -2 for a two-sample problem

  • one-sample mean CI t-table formula: xˉ±t∗⋅(σn)\bar{x} \pm t^* \cdot (\frac{\sigma}{\sqrt{n}})

  • two-sample mean CI t-table formula: (x1ˉ−x2ˉ)±t∗⋅sp2n1+sp2n2(\bar{x_1} - \bar{x_2}) \pm t^* \cdot \sqrt{\frac{s_p^2}{n_1} + \frac{s_p^2}{n_2}}

such that sp2=(n1−1)s12+(n2−1)s22n1+n2−2s_p^2 = \frac{(n_1 - 1) s_1^2 + (n_2 - 1) s_2^2}{n_1 + n_2 -2}

Note: There are several different methods that can be used to calculate the confidence interval for small one and two-sample proportions that are not listed here.


Such that:

nn = Number of members in sample

n1n_1 = Number of members in sample #1

n2n_2 = Number of members in sample #2

xˉ\bar{x} = Sample Mean

x1ˉ\bar{x_1} = Sample #1 Mean

x2ˉ\bar{x_2} = Sample #2 Mean

Δ\Delta = hypothesized difference between the two population means

p^=xn\hat{p} = \frac{x}{n}

σ\sigma = Standard Deviation

σ1\sigma_1 = Standard Deviation for Sample #1

σ2\sigma_2 = Standard Deviation for Sample #2

sps_p = pooled estimate of the variance between two sample means

α=1−confidencelevel100α = 1 - \frac{confidence level}{100}

confidence level = 90%, 95%, 99%, etc...

Some common Z∗Z^* values are 1.645, 1.96, and 2.576 for confidence levels 90%, 95%, and 99% respectively. More can be found on a Z-table.

t∗t^* values can be found on a t-table based on the desired confidence level and degrees of freedom.


Hit "Continue" for a CI calculation walkthrough for a one-sample mean and one-sample proportion problem

Confidence interval for one-sample mean

Question: The average score obtained by 10 students in a test is 75. Standard deviation of the sample is 8. Find the confidence interval at 95% confidence level.

Step 1) State our given variables

Given:

nn = 10 --> Therefore df=10−1=9df = 10-1 = 9

xx = sample mean = 75

σ\sigma = standard deviation = 8

confidence level = 95%

Step 2) Plug values into appropriate CI formula

Because our sample of n = 10 is less than 30, we use a t-table.

x±t∗⋅(σn)x \pm t^* \cdot (\frac{\sigma}{\sqrt{n}})

75±t∗⋅(810)75 \pm t^* \cdot (\frac{8}{\sqrt{10}})

75±2.262⋅(810)75 \pm 2.262 \cdot (\frac{8}{\sqrt{10}})

Hence our CI is: [69.2775,80.7225]


Confidence interval for one-sample proportion

Question: We survey 76 veterinarians from several local veterinary clinics. 19 reported that they are left-handed. Thus 19/76 = 0.25 is our estimate of the proportion of left-handed veterinarians. We want to determine how accurate this estimate is by calculating a confidence interval to give us a confident understanding of the percentage of veterinarians that are left-handed. What is the confidence interval for α=0.05\alpha=0.05 based on this data?

Step 1) State our given variables

x=numberSucessesx = numberSucesses

n=sampleSize=76n = sampleSize = 76

p^=xn=19/76=0.25\hat{p} = \frac{x}{n} = 19/76 = 0.25

α=0.05\alpha = 0.05 --> α=1−confidencelevel100\alpha = 1 - \frac{confidence level}{100}

Therefore, confidenceLevel=95confidence Level = 95%

Therefore Z∗=1.96Z^* = 1.96

Step 2) Plug in values into appropriate CI formula

p^±Z∗⋅p^(1−p^)n\hat{p} \pm Z^* \cdot \sqrt{\frac{\hat{p}(1-\hat{p})}{n}}

0.25±1.96⋅0.25(1−0.25)760.25 \pm 1.96 \cdot \sqrt{\frac{0.25(1-0.25)}{76}}

[0.1526,0.3474] is our confidence interval

So provided this data came from a random sample, we are fairly confident that the true percentage of left-handed veterinarians is between .15 and .35


Hit "Continue" for a CI calculation walkthrough for a two-sample mean and a two-sample proportion problem


Confidence interval for two-sample mean

Question: What is the 95% confidence interval for these given values?

Step 1) State our given variables

x1ˉ=21\bar{x_1} = 21

x2ˉ=12.1\bar{x_2} = 12.1

n1=13n_1 = 13

n2=17n_2 = 17

s12=4.9s_1^2 = 4.9

s22=5.6s_2^2 = 5.6

sp2=(n1−1)s12+(n2−1)s22n1+n2−2=(13−1)4.9+(17−1)5.613+17−2=5.3s_p^2 = \frac{(n_1 - 1) s_1^2 + (n_2 - 1) s_2^2}{n_1 + n_2 -2} = \frac{(13 - 1) 4.9 + (17 - 1) 5.6}{13 + 17 -2} = 5.3

df=n1+n2−2=13+17−2=28df = n_1 + n_2-2 = 13 + 17 -2 = 28

From t-table --> t∗=2.045t^* = 2.045

Step 2: Plug in values into appropriate CI formula

(x1ˉ−x2ˉ)±t∗⋅sp2n1+sp2n2(\bar{x_1} - \bar{x_2}) \pm t^* \cdot \sqrt{\frac{s_p^2}{n_1} + \frac{s_p^2}{n_2}}

(21−12.1)±2.045⋅5.313+5.317( 21 - 12.1) \pm 2.045 \cdot \sqrt{\frac{5.3}{13} + \frac{5.3}{17}}

[7.165, 10.634] is our confidence interval


Confidence interval for two-sample proportion

Question: In two different space camp groups (#1 and #2), space camp participants were asked whether or not they LOVED mathematics. There were 96 participants in Group #1 and 123 participants in Group #2. 18 participants in Group #1 and 60 in Group #2 reported that they LOVED math. What is the 99% confidence interval for the difference between the two proportions?

Step 1) State our given variables

n1=96n_1 = 96

n2=123n_2 = 123

x1=18x_1 = 18

x2=60x_2 = 60

confidence level =99= 99%

Therefore Z* = 2.576

p1^=x1n1=60123=0.4878\hat{p_1} = \frac{x_1}{n_1} = \frac{60}{123} = 0.4878

p2^=x2n2=1896=0.1875\hat{p_2} = \frac{x_2}{n_2} = \frac{18}{96} = 0.1875

Step 2: Plug in values into appropriate CI formula

p1^−p2^±Z∗⋅p1^(1−p1^)n1+p2^(1−p2^)n2\hat{p_1} - \hat{p_2} \pm Z^* \cdot \sqrt{\frac{\hat{p_1}(1-\hat{p_1})}{n_1} + \frac{\hat{p_2}(1-\hat{p_2})}{n_2}}

(0.4878−0.1875)±2.576⋅0.1875(1−0.1875)96+0.4878(1−0.4878)123(0.4878- 0.1875) \pm 2.576 \cdot \sqrt{\frac{0.1875(1-0.1875)}{96} + \frac{0.4878(1-0.4878)}{123}}

[0.1453,0.4553] is our confidence interval

This means that we are 99% confident that the true value of the difference between the two population proportions lies between .1435 and .4553
Illustrated · 2 min

Confidence Interval

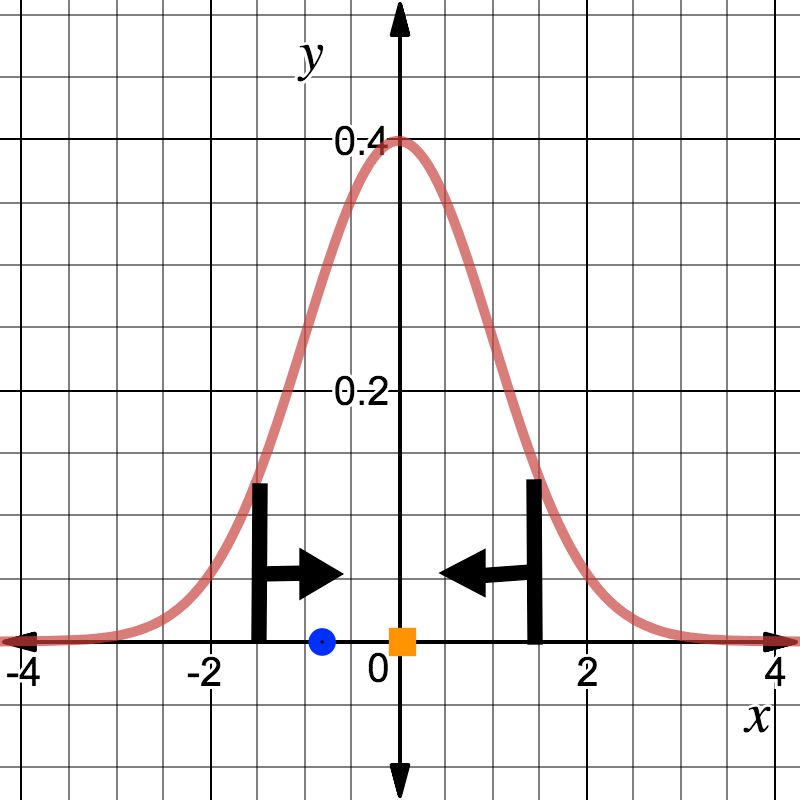
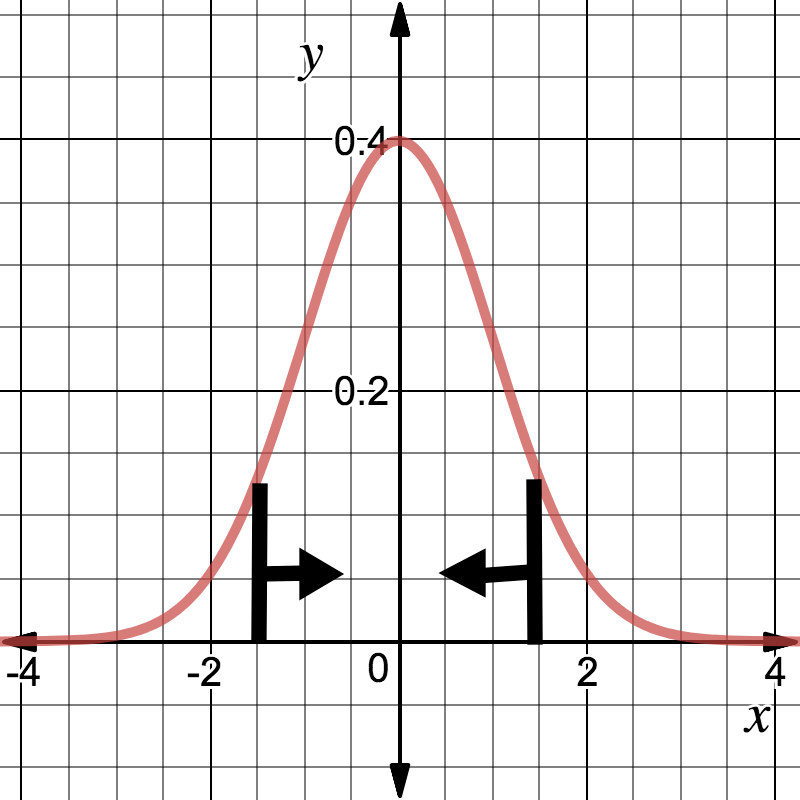
A confidence interval (everything between the black brackets in the graph below) is a range of data of which is likely to contain the true value (orange square) of the parameter of interest within a study if we were to run the experiment on a random sample again.

We will never know that the true value is as we cant conduct research on every member in a population, but we can be extremely confident that it is within some interval.

confidence interval

confidence interval with "true" value (orange square) and sample value (blue dot)

A parameter is an unknown number that describes an entire population. Some example of parameters are the median or average of a dataset.

(The parameter of interest from a single sample is represented by the blue dot on the x-axis, the orange square represents the "true" parameter value for this study which will never actually be known)

Hence, the parameter of interest is some number that is interesting to you, as a researcher, that describes the population you are studying.

Up Next

Confidence Levels (CI) (1 - α\alpha), Significance Levels (α\alpha), One-Sided/Two-Sided Confidence Intervals

Confidence intervals are created based on the level of confidence (usually 9090%, 9595%, 9999%) you as a researcher would like to be sure that the parameter of interest lies within the confidence interval.

So if you had a confidence level of 9595%, this means that if you randomly conducted your study over and over again with different samples, your parameter of interest for each study would lie within the confidence interval 9595% of the time.

The confidence level is often denoted by (1−α)(1 - \alpha), where α\alpha is pronounced "alpha" and α\alpha is referred to as the significance level.

Here are the significance levels (α\alpha) for the commonly used confidence levels:

  • 0.900.90 or 9090% ---> 0.90=(1−α)−−−>α=0.10 or 100.90 = (1 - \alpha) ---> \alpha = 0.10 \text{ or } 10%

  • 0.950.95 or 9595% ---> 0.95=(1−α)−−−>α=0.05 or 50.95 = (1 - \alpha) ---> \alpha = 0.05 \text{ or } 5%

  • 0.990.99 or 9999% ---> 0.99=(1−α)−−−>α=0.01 or 10.99 = (1 - \alpha) ---> \alpha = 0.01 \text{ or } 1%

One-Sided and Two-Sided CIs

Confidence intervals can also be categorized as one-sided or two-sided.

A two-sided confidence interval brackets the population parameter from both above (+) and below (-).

confidence interval

confidence interval

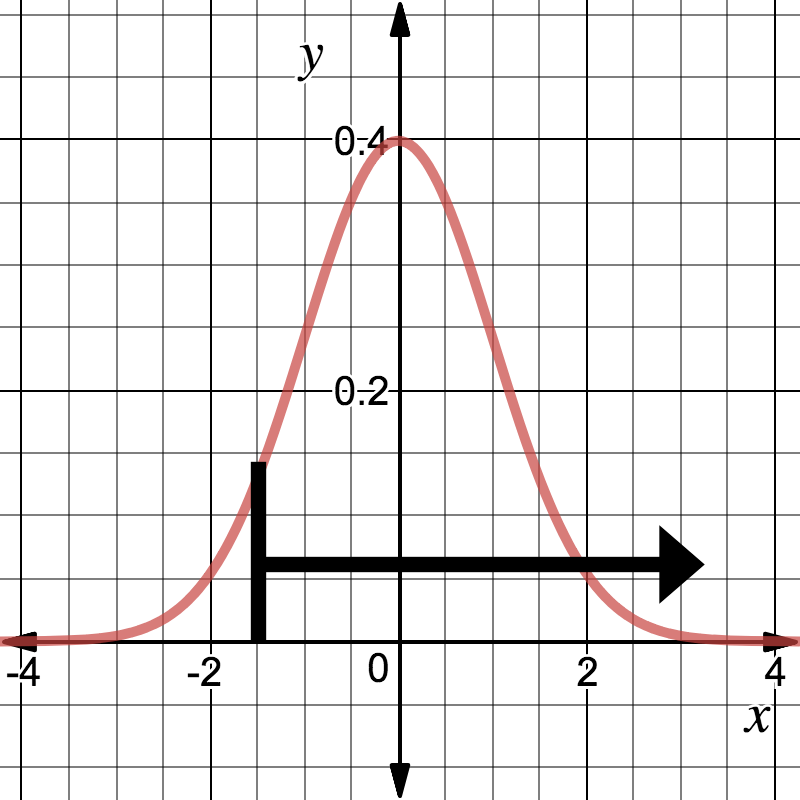
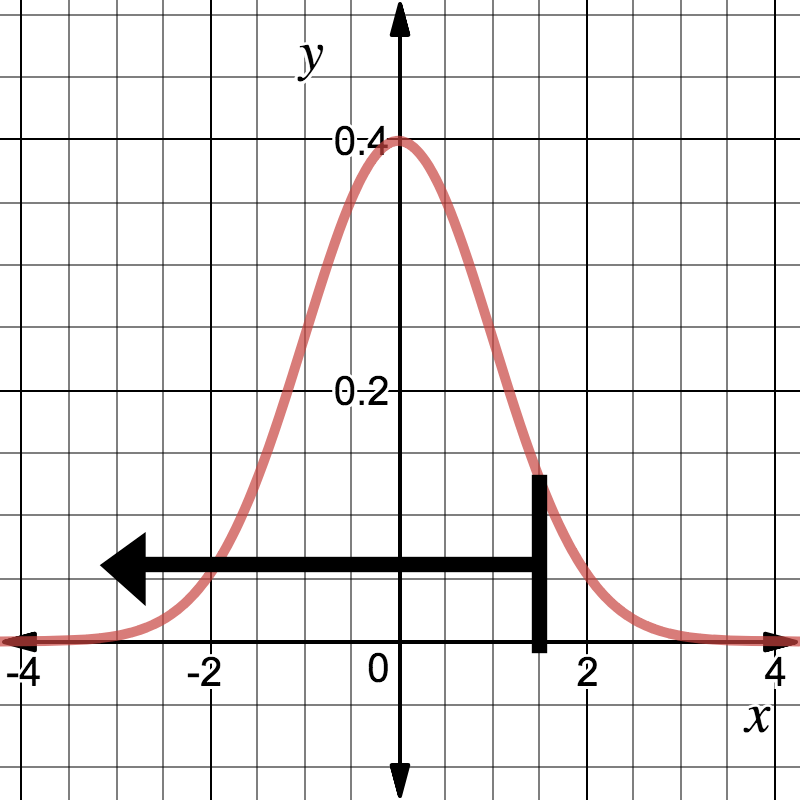
A one-sided confidence interval brackets the population parameter from one side only.

confidence interval to the right (one sided)

one sided right confidence interval

one sided left confidence interval

one sided left confidence interval

Video

(Video) Confidence Intervals Animation

by Statistical Learning Group

Check out this video for a monster-themed explanation about how to calculate a confidence interval and what it means.

This is a very fun video that explains clearly why we calculate confidence intervals and how to interpret them.

A confidence interval is essentially a way for us to write an interval of values where we are confident that the true population mean lies in. Most of the time, we use a 95% confidence interval, meaning we are 95% confident that the true population mean lies within the calculated confidence interval.

In the video, you can see how the monster statistician calculates with 95% confidence that the mean weight of the monsters on the island is between 5.783 and 6.575, which helps them plan out their seating arrangement for their monster occupied planes.

Type a concept, like “slope” or “photosynthesis”.

↑ ↓ to choose · Enter to openSearch explanations and problems