Interactive · 2 questions

Let's say we are given a population, say, all of the books in the world. That is way too many books to count. If we want to use a number to describe something about the population, that number is called a parameter.

Since the population of all the books in the world is too large to count, we can take a small portion of that population, maybe 100 books. If we want to use a number that says something about this sample, that number is a statistic.

We want to say something about the lifestyle of all the animals in the world. We randomly choose 5050 animals and study their lifestyle.

Choose one answer

Read · 1 min

Statistic

A statistic is an estimate of some "true" value (population parameter). It is a numerical value or measure that summarizes a particular characteristic or feature of a dataset. It provides quantitative information about the data. It can be often found in descriptive statistics and inferential statistics.

In other words, it is a piece of data from a portion of a population. It is the opposite of a parameter. A parameter is data from a census (something that surveys everyone in the population, so the full data set) .

For example, a researcher may be interested in the average number of calories an American eats per day, however they can never really know exactly how many calories Americans eat on average per day because there are simply too many Americans to ask this research question.

So, what the researcher can do is ask a representative sample of Americans the same research question. The value drawn from the sample is known as a statistic.

####Looking Further

Moving further, you will learn more about statistical methods, including types of sampling (i.e., random sampling), hypothesis testing (i.e., null hypothesis), and standard deviation.

Read · 2 min

Statistics

Statistics is a science that studies and develops methods for collecting, analyzing, interpreting and presenting data. So, let’s say for example, that we want to know the average height of everyone in a class. We would have to gather data of every student’s height, then we can find the average through some mathematical processes!

There are two fundamental ideas in statistics: uncertainty and variation. There are many situations in life, science, or math where the outcome is not certain. This may be because the outcome in the question is not determined yet (i.e. whether it it will be sunny tomorrow) or other cases are uncertain because although the outcome is already determined, we are not aware of the results (i.e. not knowing whether you passed an exam or not). This is a cousin of statistics called probability. Now, statistics and probability go hand in hand. With these uncertain events, we can use probability to discuss what the results could probably be, or what the results are most likely.

Variation in data is how spread out, or clustered, the data is. So if you study the ages of a group of people, the youngest may be 1212 and the oldest may be 8787. There will be a variation in the data since not every person in the group is the same age.

Population vs. Sample

A population is a complete set of observations that can be made. For example, if you are studying the lengths (in pages) of books, the population would be the set of lengths of all books in the world. Now, that is a lot of books and there’s a very slim chance you would be able to collect all this data. In fact, populations are generally difficult to study since they usually include extremely large numbers of subjects that may be unavailable to you (i.e. books in museums, books that someone wrote on their own and did not publish).

A sample is a set of observations drawn from a population. Samples are used when it isn’t exactly possible to study entire populations due to sheer size or lack of availability of subjects. If you wanted to study the hair color of 2525-year-old women, it would be impossible to survey EVERY 2525-year-old woman. However, you could survey a sample of 5050 2525-year-old women to get data for your study.

Parameter vs. Statistic

Now, we discussed above what a statistic is. A statistic is a known number that describes a sample. Statistics can change from sample to sample, since not every sample is the same.

A parameter is a fixed number that describes a population. These do not vary from parameter to parameter, since the population includes ALL samples and it will not change. We most likely do not know these numbers because we cannot examine the entire population. Now, since we primarily work with samples, we can say that a statistic is an estimate of a parameter


Illustrated · 1 min

A Statistic

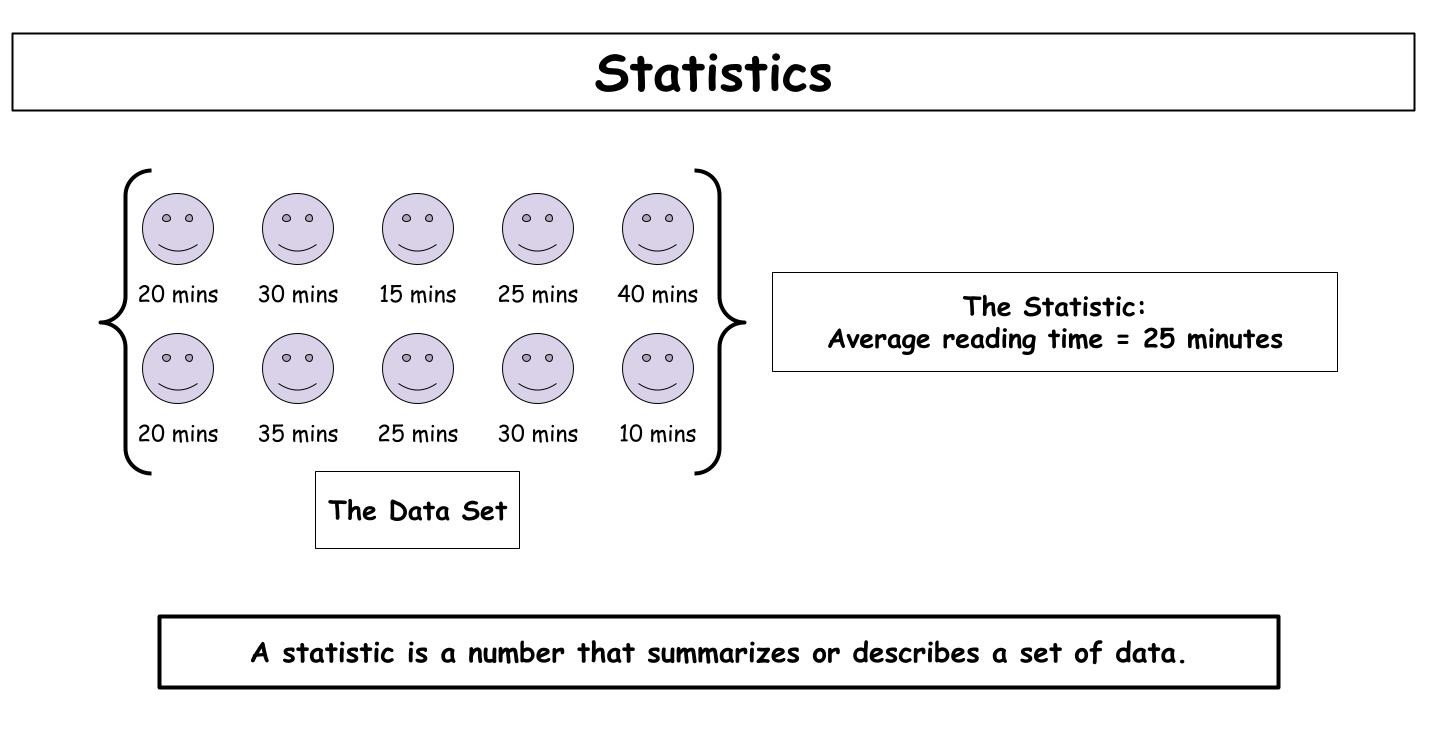
We've talked a lot about probability, so it's now time to move onto statistics. Statistics is the branch of math that helps us to collect, organize, study, and understand data. Especially today, when our world has so much data, it is critical that we master statistics. A statistic is a number that describes a group of data.

For example, imagine that 2020 students are asked how many minutes they spend reading each day. Their answers make up a data set. We could calculate the average reading time to describe the group with one number. That average is an example of a statistic.

Statistics can help us understand information that might otherwise be difficult to interpret. Instead of looking at every value separately, we can use statistics to summarize the data. The mean, median, and mode are common statistics that describe the center of a data set. Other statistics, such as the range, can tell us how spread out the values are.

A statistic is a number that summarizes or describes a set of data.

Image source: by Anusha Rahman

Statistics can also be used to compare different groups. For example, we could compare the average reading time of two different classes. This may help us notice patterns or differences between the groups.

Sometimes it is not possible to collect information from every person in a large group, called a population. Instead, researchers may collect data from a smaller group called a sample. They can calculate statistics from the sample and use them to learn about the larger population.

Statistics are used in science, sports, business, medicine, and many other areas. You may also see statistics in news stories, surveys, graphs, and reports. Learning about statistics helps you understand what data tells us and make better decisions based on evidence.

In the next lesson, we will dive into scales of measurement. Then, we will get into sampling bias.

Video

(Video) What is Statistics?

by LearnFree

Watch this video to gain a broad understanding of what statistics is and how it's used in the real world.

As the video explains, statistics can help us organize large amounts of data to look at a whole group. An example of a statistic would be if we summarized the ages and heights of the various people in the group the video mentions with a number, such as if we averaged them. It would be important to know the average age of a group for numerous reasons, for example if we were planning a trip to the movies and wanted to know what an age-appropriate film would be for the whole group.

Continue watching the video to see examples of everyday uses of statistics - from the algorithm of what TV shows are recommended to you to healthcare research.

Type a concept, like “slope” or “photosynthesis”.

↑ ↓ to choose · Enter to openSearch explanations and problems