Illustrated · 1 min

The Normal Distribution

The normal distribution is one of the most common probability distributions. Some key characteristics are that it is unimodal, symmetric, and bell-shaped. There is a normal distribution for every mean and standard deviation. Normal distributions are often written as N(μ,σ)N(\mu, \sigma) where mu (μ\mu) is the mean and sigma (σ\sigma) is the standard deviation. For example the normal distribution N(5,100)N(5, 100) has a mean 55 and a standard deviation of 100100.

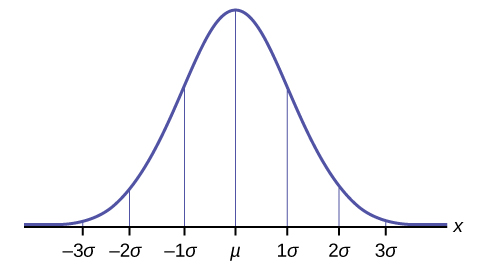
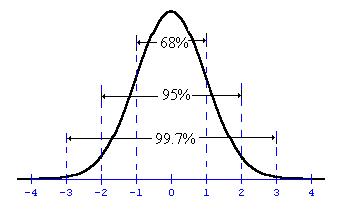
Normal distribution curve with standard deviations -3 to 3

Image source: by Karen Ying

We can locate the standard deviation of a normal curve by eye. As we move out move out in either direction from the center, the curve changes from falling steeply to more gradually. The first standard deviation is when this change is most prominent.

A special type of normal distribution is the standard normal distribution. The standard normal distribution has a mean of 00 and a standard deviation of 11, N(0,1)N(0,1).

Real Life Applications of the Normal Distribution

We see the normal distribution a lot in real life. We generally see the normal distribution in large populations or large datasets. Say we were to graph the height of every single person in the country. Most of the people would fall close to the average, and a pretty even number of people would fall on either side of the mean. As we were to graph more and more people, you would probably find that the curve begins to look like a normal distribution. We would notice the same pattern when graphing IQ, income distribution, birth weight, and a lot of probability.

Next Lessons

The next lessons will cover different features of normal distribution. You'll learn about the empirical rule, the central limit theorem, and skews. You will also learn about z-scores.
Interactive · 3 questions

Normal Distribution

What is the normal distribution? In statistics, a normal distribution (or the Gaussian distribution) is described by a normal density curve. All normal distributions are completely specified by two numbers: the mean (μ)(\mu) and standard deviation (σ)(\sigma). Normal distribution curves are abbreivated as N(μ,σ).N(\mu,\sigma).

Properties of the Normal Distribution

Although there are an infinite amount of normal curves, they all share similar properties. Normal distributions are symmetric, and 50% of the data is to the right of the center, and 50% is to the left of the center.

Let's test your knowledge! What measurements of a normal curve are always equal? Check all that apply.

Choose all correct answers

Illustrated · 1 min

The Normal Distribution vs. Other Distributions

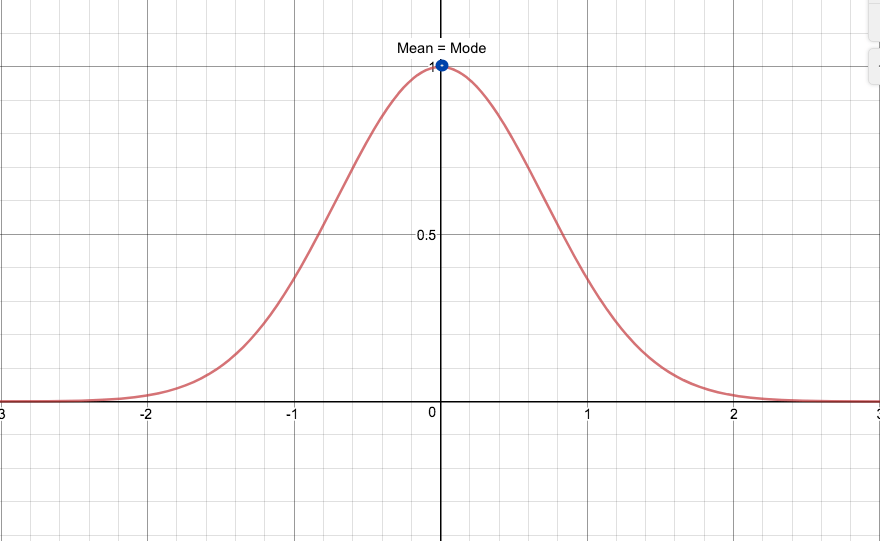
A normal distribution looks like a symmetrical bell-shaped graph where the mean = mode of the data set. This point is located at the highest point or middle of a normal distribution.

A normal distribution, which looks like a bell.

Made using Desmos

A normal distribution looks like a "bell" curve!

For non-normal distributions (also referred to as "skewed" distributions), the mean and mode are not equal in value. One is either bigger or smaller than the other, and the highest point is shifted either to the left or right.

Video · + 1 min read

(Video) The Normal Distribution, Clearly Explained!!!

by StatQuest with Josh Starmer

Check out this video by StatQuest to learn all about the normal distribution! We have already learned of other ways to visualize data, like box and whisker plots, but normal distributions are especially helpful when thinking of large data sets from studies including observational and experimental studies.

Just like Josh explains in the video, normal distributions, also commonly known as bell curves, represent datasets like human height. The middle of the normal distribution represents the average. The taller parts of the curve are the more common datapoints and the shorts parts of the curve are the less common datapoints. The width of the curve depends on the standard deviation. In normal distributions, 95% of datapoints fall within two standard deviations (both in the positive and negative directions) of the mean. The height of the curve tells us the probability of certain values of the data occurring, which can be helpful when comparing datasets.

Now, practice drawing your own normal distributions!

Illustrated · 1 min

The Normal Distribution

The normal distribution is a type of density function. There's a theory in statistics that random variables with a Gaussian distribution will take on the shape of a normal distribution when the sample size is at least n=30n=30.

The standard normal distribution is when mean is zero and the standard deviation is one.

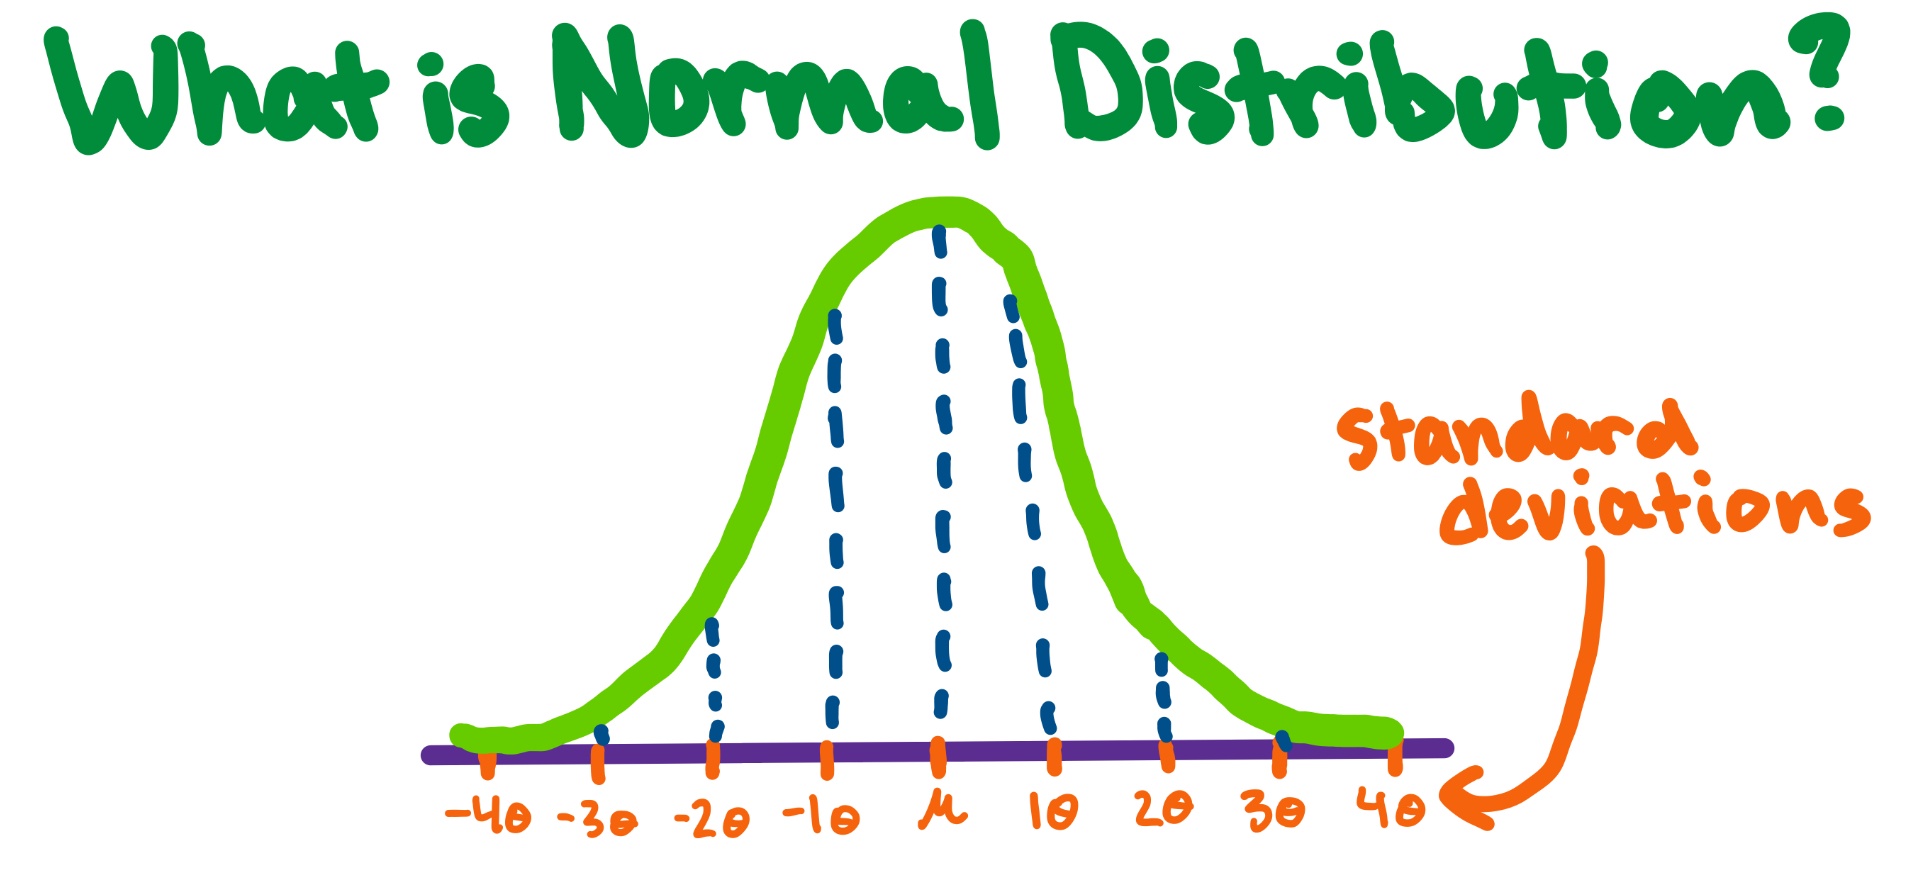
What is normal distribution?

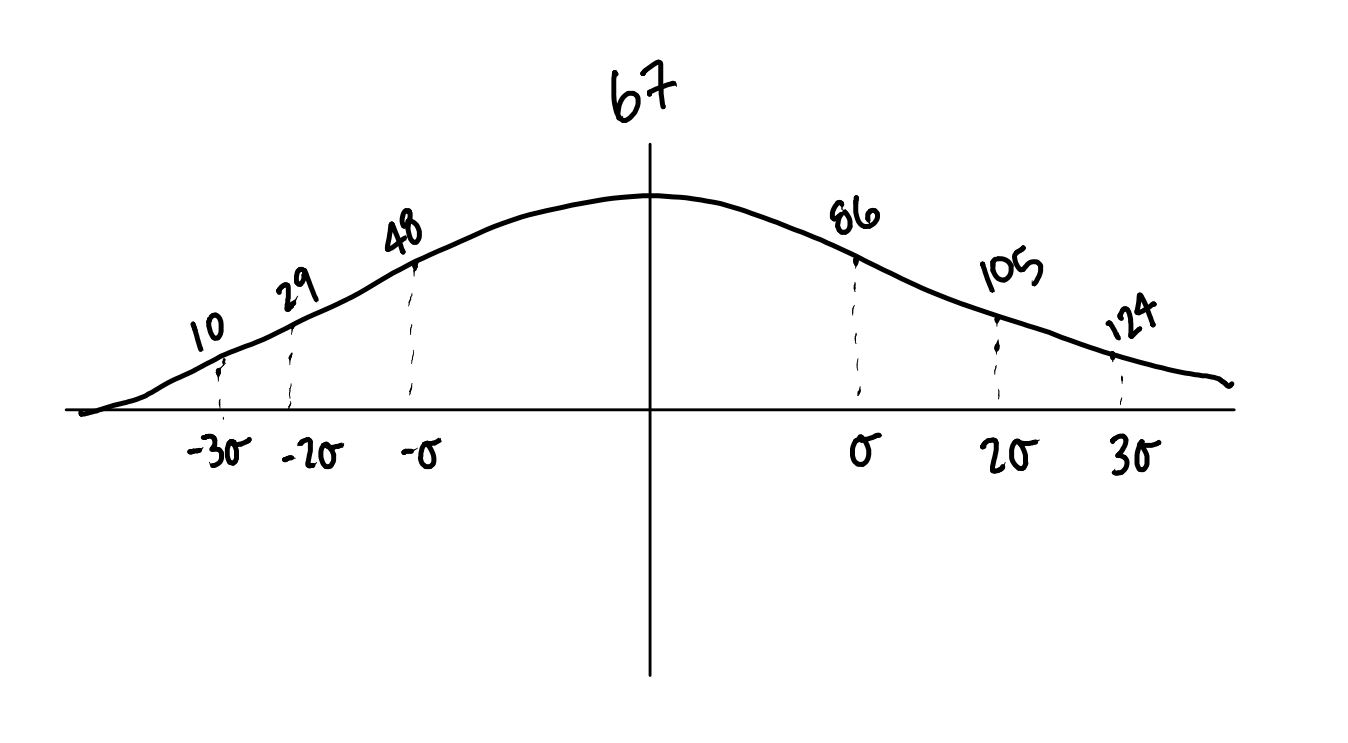
Normal curve on top of number line with multiples of standard deviation labeled.

Image Source: By Trisha

The total area under the curve will always equal 11.

The cumulative normal distribution is a probability theory that tells us in a population XX, the probability that a value, xx will fall between negative infinity and xx. On a calculator, you may have seen this function as CDF.

Type a concept, like “slope” or “photosynthesis”.

↑ ↓ to choose · Enter to openSearch explanations and problems