Writing Common Functions from Graphs and Tables

Before this, knowWhat are parent or common functions?

Video · + 1 min read

(Videos) Writing Rules for Linear and Non-Linear Functions

by MisterE47 and Tim Smith

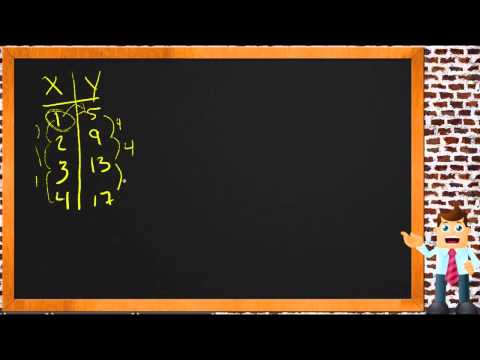
In this video, MisterE47 explains how to write a linear function rule from a set of points or table.

The easiest way to turn a set of linear coordinates into a function rule is to put them into point slope form (y=mx+by = mx + b). You can do this through a couple of steps:

  1. Find the slope.

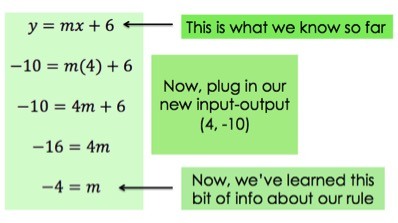
  2. Find the y-intercept. If one of your points has 00 as the value of xx, the value for yy is the y-intercept! If not, you can calculate it by using the slope you've just found.

In this video, Tim Smith gives examples of how to write rules for non linear functions using tables.

There's no easy sequence of steps for finding nonlinear function rules--the key is just to recognize patterns in how the input and output values change! If you can find a pattern (or see a pattern in a graph), you can try to match the points with the shape of a parent function.

Interactive · 2 questions

Using Rules to Describe Patterns

One of the cool things about math is that we can take a pattern we see in numbers or data and turn it into a mathematical expression. I know that sounds highly un-cool, but if you think about it, it's pretty amazing.

If there's a pattern or trend in your data, you can build an expression that represents it. The expression can bottle up all of your data into one neat little package. Often, we call this expression a rule.

Message in a bottle.

Image source: OpenClipart-Vectors CC0 via pixabay.com

Let's say you're given the following information:

Input (x) // -2 // 0 // 4  // 5
Output (y) // 14 // 6 // -10 // -14

Image source: by Hannah Bonville

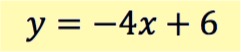
We can use this information to write the function rule. The function rule is just an equation that represents a linear function.

So, when we've got a table of values like the blue one above, to write the rule, all we need to do is figure out what linear equation the function follows.

Recall that the equation of a line (i.e, for a linear function) is:

y = mx + b

Image source: by Hannah Bonville

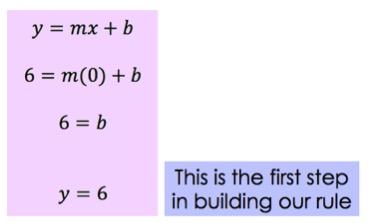
It's easiest to start building the rule by consider the input-output pair where the input (xx) is 00.

From our table above, what is the value of yy (i.e., the output of the function) when x=0x=0?

Choose one answer

Video

(Video) Write a Function Rule

by CK-12 Foundation

Sometimes, translating words into math is called "writing a function rule." In other words, writing a function that describes a pattern that you can write out in a table or describe in words. In the video below, Mr. Spence describes how to take a pattern in a table and write a function to predict how the pattern will play out with any value of xx.

Try it yourself! Try to figure out what the pattern is in the following table:

xy031427312419528\begin{array}{r|l} x & y \\ \hline 0 & 3 \\ 1 & 4 \\ 2 & 7 \\ 3 & 12 \\ 4 & 19 \\ 5 & 28 \end{array}
Choose one answer

Illustrated · 1 min

Writing Linear Functions \\

There are a couple components to a linear function. Before we jump into it, consider this question:

How many points do you need to determine where a line is?

As you can see, if you are only given 1 point, you can have an infinite amount of lines going through that point.

However, if you are given 2 points, you can only have one line that goes through both points.

This means, to write, or determine the function for a line, you really need 2 points on that line.

Now, some components of a linear function \\ We have: \\ y-intercept: where the line intercept with the y-axis \\ x-intercept: where the line intercept with the x-axis \\ slope: how slanted the line is; you can find the slope with 2 points--you will learn how to do this in the future!

x-intercept and y-intercept

the slope

Illustrated · 1 min

How to Write Common Functions Using Graphs and Tables

So far, we've used graphs to find the function values. But we can also do it the other way.

If you're given a table of values, find a pattern, and map to a parent function.
Patters could look like: x squared plus 2, x cubed minus 2, x plus 4, and many more!
Remember your parent functions: linear, quadratic, cubic, exponential, logarithmic, and a few more!

Image source: by Anusha Rahman

When writing a function from a graph or a table, you're looking for a pattern that shows how one thing changes in relation to another. Start by identifying the relationships between the xx-values (the input) and the yy-values (the output). If the graph shows a straight line, the function is usually in the form of y=mx+by=mx+b, where mm is the slope and bb is the yy-intercept.

In a table, look at how the yy-values change as the xx-values increase or decrease. If the changes are consistent, you likely have a linear function. For other patterns, like curves, you might need a different type of function, like a quadratic or cubic function.

Type a concept, like “slope” or “photosynthesis”.

↑ ↓ to choose · Enter to openSearch explanations and problems