Read · 1 min
+1 contributors

Mean
Mean, as used in statistics, is one of the measures of central tendency. It is equivalent to the common usage of the word "average."
How to calculate the mean
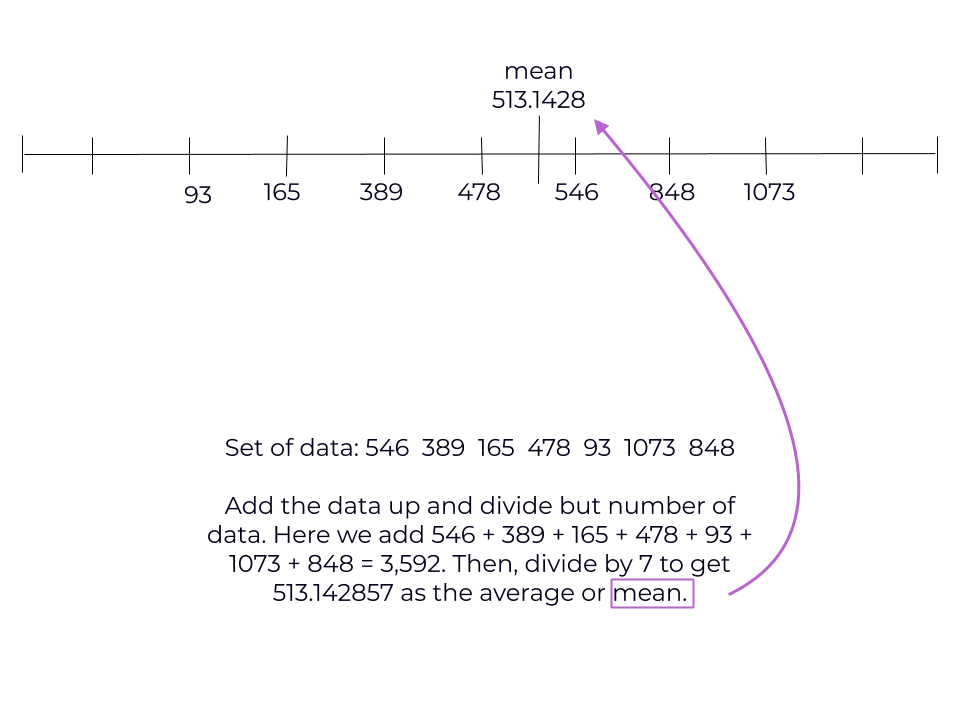
The mean is defined by the sum of all the data divided by the number of data points.
If you have data points with values , the mean is calculated by or more formally,
When to use the mean
Try not to use the mean when there are outliers, or points far away from the vicinity of most of the points.
For example, here are some hypothetical test scores:
If you calculate the mean of those numbers, you get . However, that is lower than 9 of the scores! The 43 pulls down the average and gives a result that doesn't represent the set very well.
Oftentimes, the better tool to use when there are outliers is the median. However, if you want to include the outliers for some reason, the mean is the better measurement.