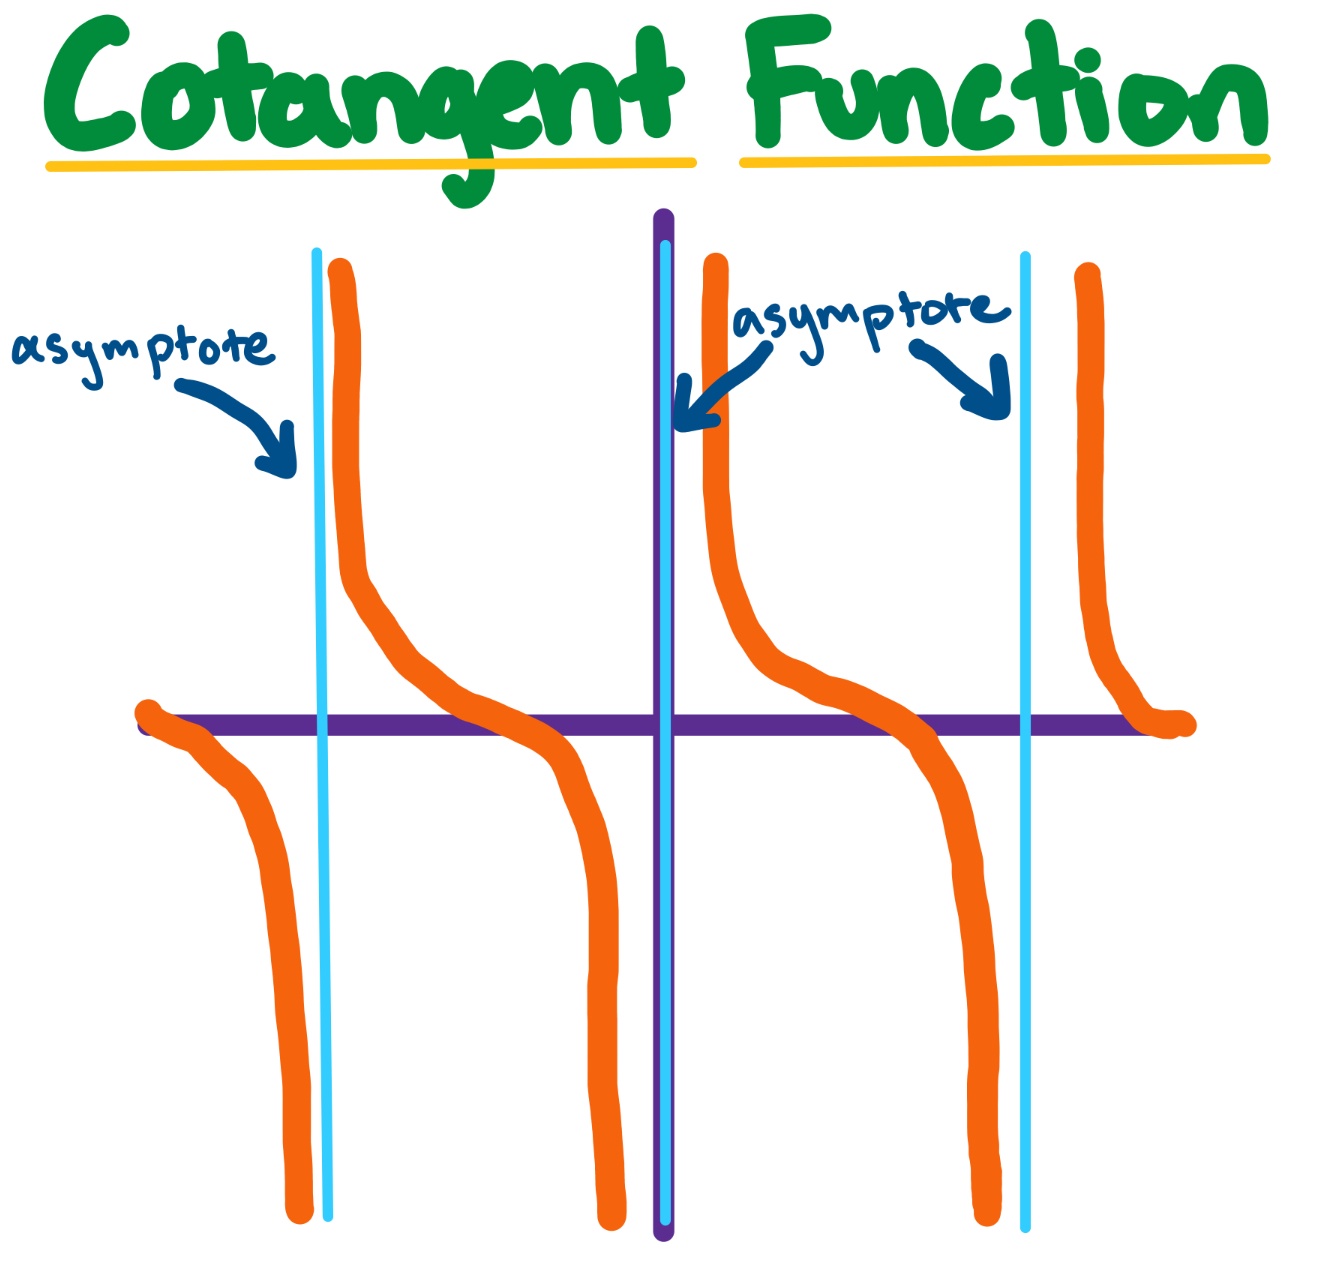
In this video by Brian McLogan, you will learn how to graph the cotangent function.
Summary
Graph y= cot (2x)
With cotangent, we are not as concerned with the amplitude. We are concerned with the period, though. We know that the period of the function is bπ=21π=2π.
In the parent function of cotangent, cot (x), the vertical asymptotes are x=0 and x=π. Because we are changing what is inside of the parentheses, we are also changing the vertical asymptotes. We calculated earlier that the period is 2π, so we know that our vertical asymptotes are at x=0 and x=2π.
Now we need to tackle the x-intercept. We can find the first x-intercept by dividing the period, 2π by 2. So, our x-intercept is at π.
Ultimately, our graph looks like: