
লেখচিত্র: উত্তল ফাংশন

Illustrated · 2 min

Increasing and Decreasing Intervals

Before we can learn how to find increasing and decreasing intervals graphically, we first have to understand what increasing and decreasing intervals are.

Increasing intervals are when the output increases as the input increases, like a direct relationship. We can more commonly think of this as yy increasing as xx increases, or as a positive slope.

Decreasing intervals are when the output decreases as the input increases, like an inverse relationship. We can more commonly think of this as yy decreasing as xx increases, or as a negative slope.

As you move forward in math, you will also learn about derivatives and how you can use that to determine whether intervals on a graph are increasing or decreasing.

Finding Increasing and Decreasing Intervals Graphically

Now that we know what increasing and decreasing intervals are, we need to figure out how to find out whether a specific function interval is increasing or decreasing! We previously mentioned that slope and derivatives are two ways to find out. There's a third way -- graphing!

Let's consider the parent function of the quadratic.

Graph of quadratic function, y=x^2, with negative part purple and positive part green

Made using Desmos

The graph of this quadratic function has two different colors -- purple and green -- splitting the quadratic in half. The purple part on the left represents the decreasing interval, because as the xx value increases, the yy value decreases, until the function meets the origin. This is strictly decreasing. At the point where the function meets the origin (a relative extrema or point of inflection), the function then transitions to an increasing interval, because as the xx value increases, so does the yy value. This is strictly increasing.

So, the interval of {x<0}\{x<0\} is a decreasing interval, and the interval of {x>0}\{x>0\} is an increasing interval.

Let's talk through how we figured this out. We looked at the graph and approximated. This method of determining whether an interval is increasing is not very mathematically precise, but it serves out purpose.

Video

(Video) Determining Whether Intervals Are Increasing, Decreasing, Or Constant

by Brian McLogan

In this video by Brian McLogan, you'll learn how to determine whether intervals of a function are increasing, decreasing, or constant.

Summary

There are two steps:

  1. Read a book. Read the graph from left to right in order to understand the story of what this graph is doing.

  2. Write xx-values, read yy-values.

From left to right, you are going to look at what the yy-values are doing, as the xx value is increasing. That's why it is important to start from the left side.

We don't use the Union symbol when looking at intervals because this is different from domain and range. You'll use a comma between the intervals!

You can watch the video to visually walk through an example on a graph.

Illustrated · 1 min

Finding Increasing and Decreasing Intervals Graphically

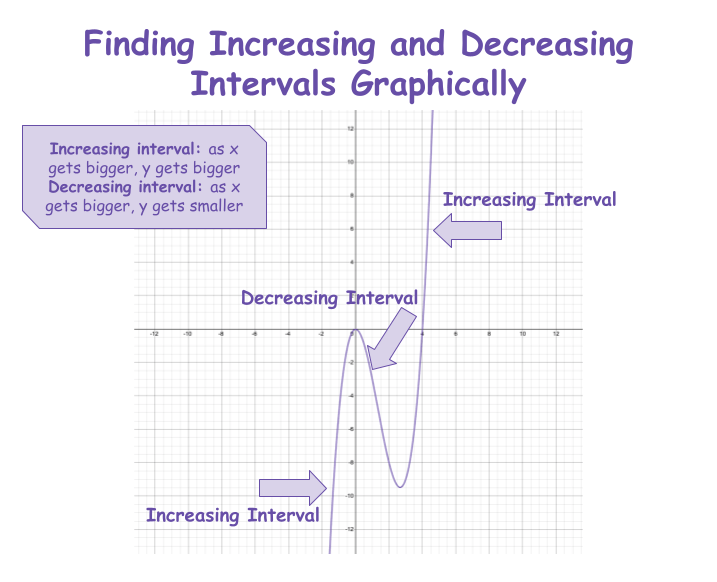
When we look at a graph, we can see how a function changes as we move from left to right. A function is increasing when the graph goes up as xx increases. A function is decreasing when the graph goes down as xx increases.

Finding Increasing and Decreasing Intervals Graphically
Increasing interval: as x gets bigger, y gets bigger
Decreasing interval: as x gets bigger, y gets smaller

Image source: by Anusha Rahman, using Desmos

To find the increasing and decreasing intervals of a graph, look at the slope of the curve. Imagine walking along the curve from left to right.

If the graph goes up as you move from left to right, then it's increasing. If the graph goes down, it's decreasing.

In other words: If the graph goes uphill, the function is increasing on that interval. If the graph goes downhill, the function is decreasing on that interval.

Mathematically, you can think of it as:

  • As xx gets bigger, if yy gets bigger, it's an increasing interval.
  • As xx gets bigger, if yy gets smaller, it's a decreasing interval.

Pro tip: always read the graph from left to right!

Turning points are points where the graph changes direction. These are often maximum points (where the graph changes from increasing to decreasing) or minimum points (where the graph changes from decreasing to increasing).

To write the intervals, use the x-values where the graph changes direction. For example, if the graph increases until x=2x=2 and then decreases, we say the function is increasing on (−∞,2)(−\infty,2).

If it starts increasing again after x=5x=5, we would say the function is decreasing on (2,5)(2,5) and increasing on (5,∞)(5,\infty).

Remember, increasing and decreasing intervals describe how the y-values change as the x-values move across the graph.

Type a concept, like “slope” or “photosynthesis”.

↑ ↓ to choose · Enter to openSearch explanations and problems