Finding the Function Inverse: Graphically
To understand the inverse of a function, we first need to know what an inverse does. The inverse of a function "undoes" what the original function does. For example, if a function takes an input and gives an output, the inverse function takes that output and gives you back the original input.
One way to find the inverse function is by looking at its graph. Here's a simple method: the graph of the inverse function is a reflection of the original function across the line y=x. This line, y=x is important because it represents all the points where the x-coordinate equals the y-coordinate.
Here is a step-by-step way to find the inverse graphically:
-
Plot the original function: Begin by drawing the graph of the function you’re working with.
-
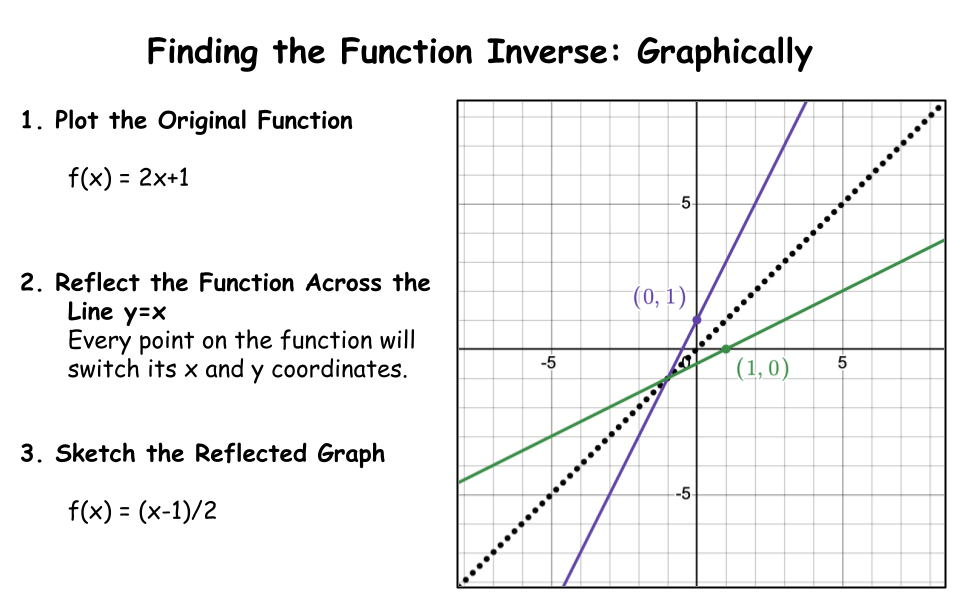
Reflect the Graph Across the Line y=x: To do this, every point on the original graph will switch its x- and y-coordinates. In the above example, the original function (purple) has the point (0,1). The coordinates will switch - which is why you can see the point (1,0) on the green inverse function.
-
Sketch the Reflected Graph: After reflecting several points, draw the curve that connects them. This new graph represents the inverse function.
Remember, the inverse function only works for functions that are one-to-one, meaning each x-value has a unique y-value. If the original function isn't one-to-one, it won't have an inverse function.
With this method, you can visualize the relationship between a function and its inverse!
Example
In the above image, we see the original function in purple, f(x)=2x+1. This is a straight line with a slope of 2 and a y-intercept of 1.
After we reflected the points, we found the green line, which is the inverse. The inverse function is f−1(x)=2x−1.