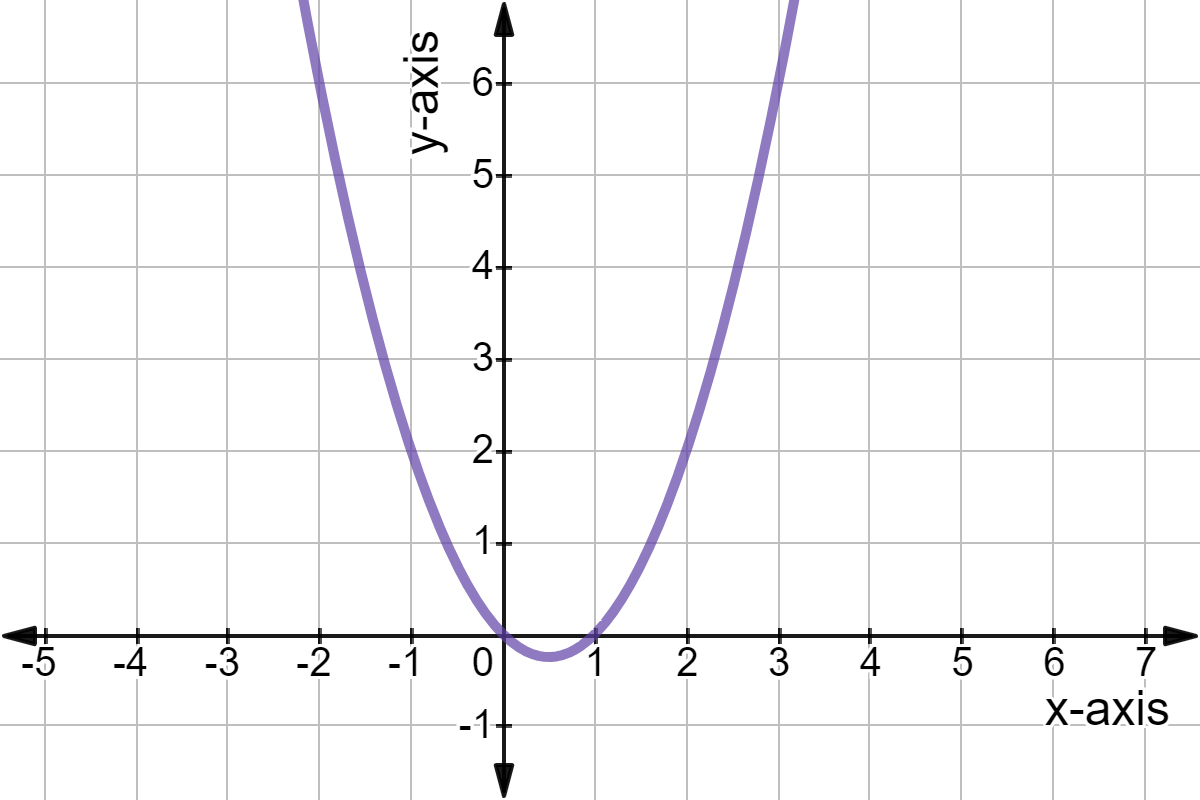
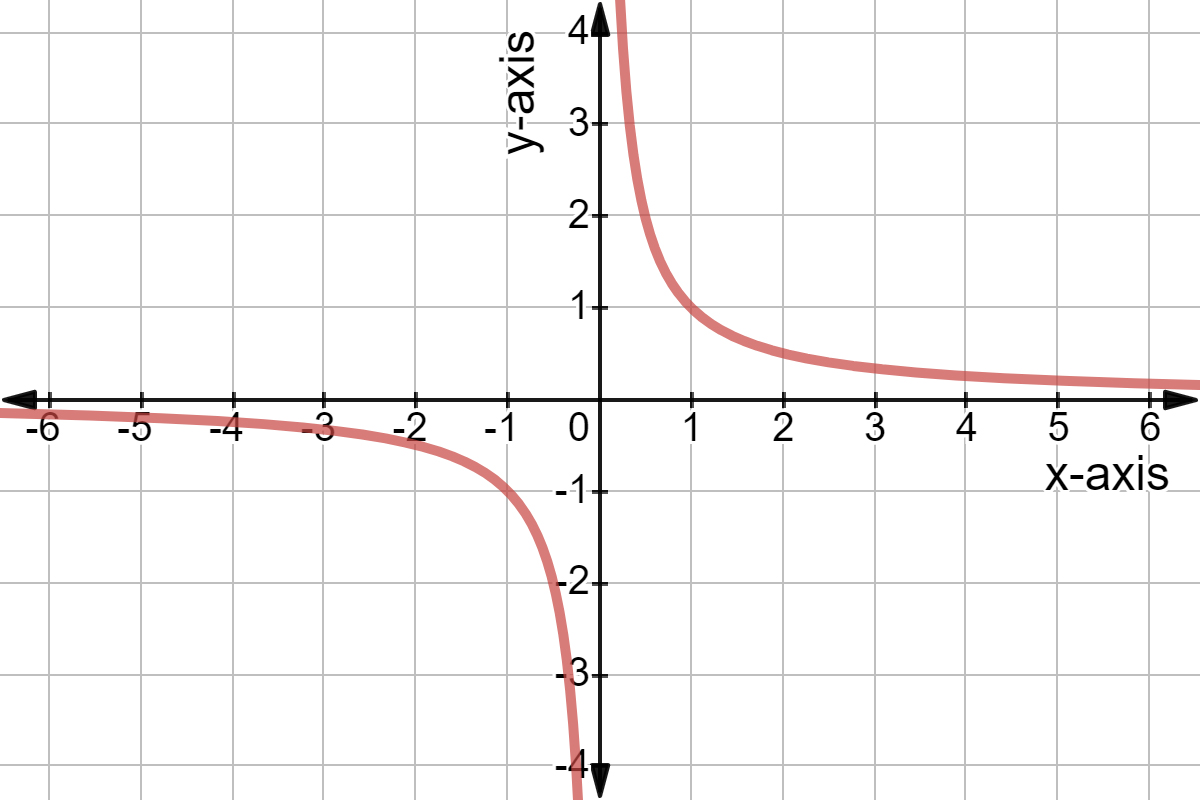
ফাংশনের লেখচিত্র কাকে বলে?

Before this, knowএকটি রৈখিক ও বক্র রৈখিক ফাংশনের নিয়ম মূল্যায়ন করোস্বাধীন চলক ও অধীন চলক

Interactive · 2 questions

Graphing Functions

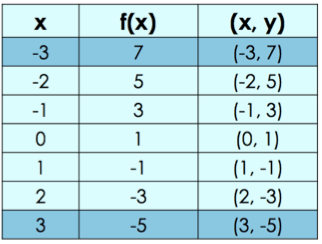
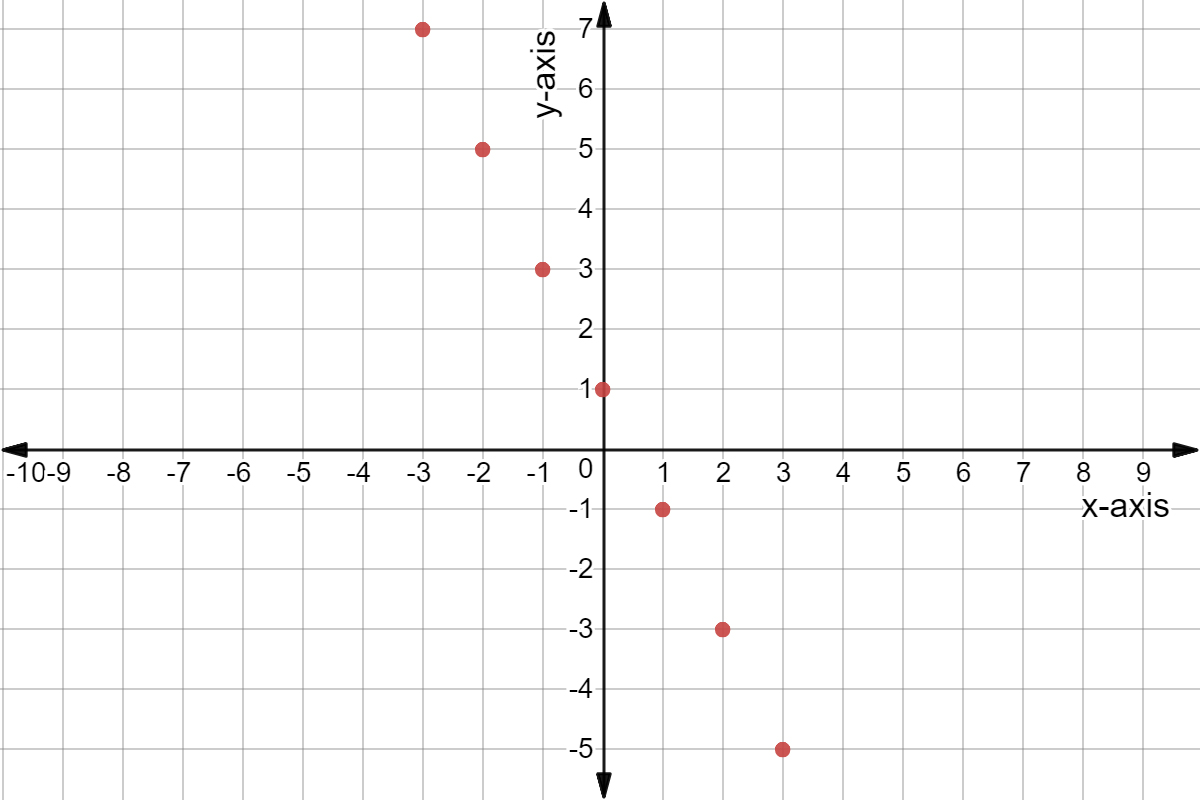
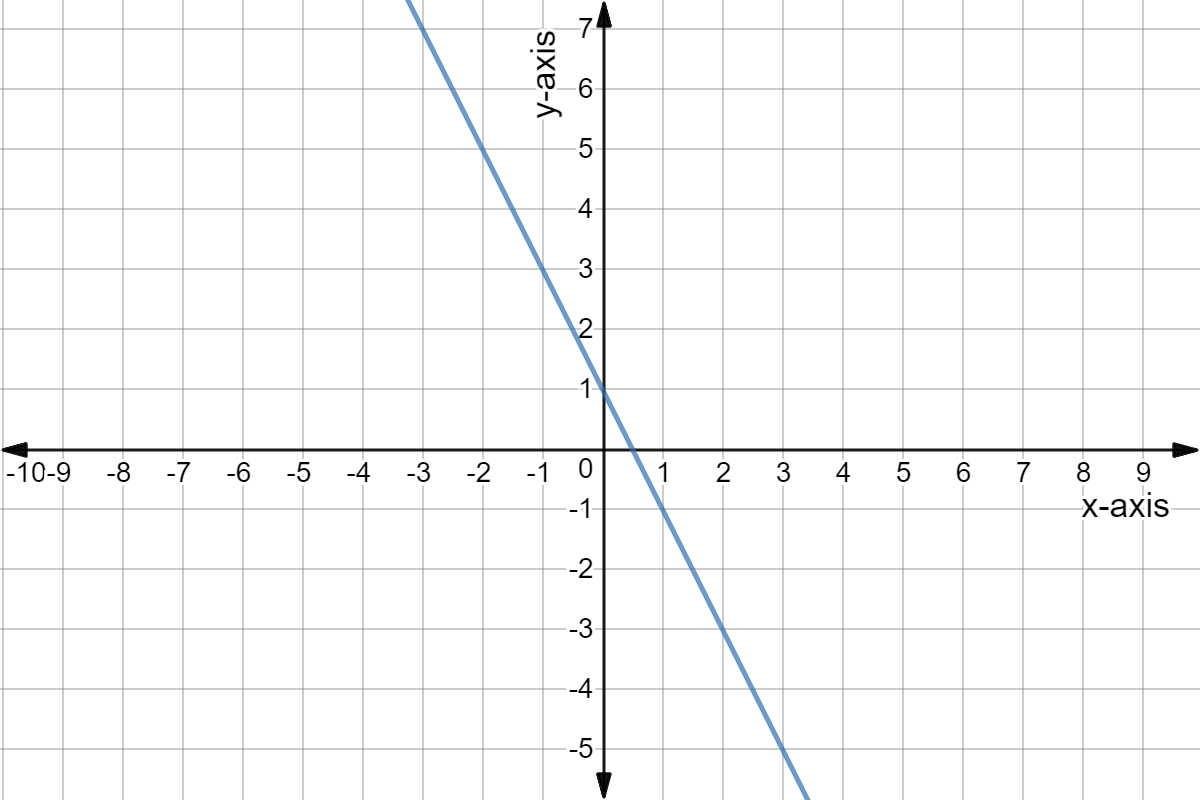
A good approach to graphing a function is to make a table of a handful of possible inputs and outputs. We'll graph the points we get from our table and connect them according to the pattern we see.

When we make our table, the inputs (xx) will be the xx-values in our coordinate pairs, and the outputs (f(x)f(x)) will be the yy-values.

Let's try an example. f(x)=−2x+1f(x) = -2x + 1 First, we're going to set up our table. It's a good idea to pick symmetrical values to plug in for xx. This means, for example, if I decide to try out x=2x=2, I should also include x=−2x=-2 in my table.

It's also a wise choice to include x=0x=0 in every table. This gives you the yy-intercept for your graph—where the line crosses the yy-axis.

If you need help figuring out how to get output values from functions, refresh yourself!

x // f(x) // (x,y)
-2 // 5 // (-2,5)
-1 // 3 // (-1,3)
0 // 1 // (0,1)
1 // -1 // (1,-1)
2 // -3 // (2,-3)

Image source: by Hannah Bonville

Let's add a few more values to our table, still using the expression from above:

f(x)=−2x+1f(x) = -2x + 1

What is the value of f(x)f(x) if x=−3x=-3?

Choose one answer

Interactive · 1 question

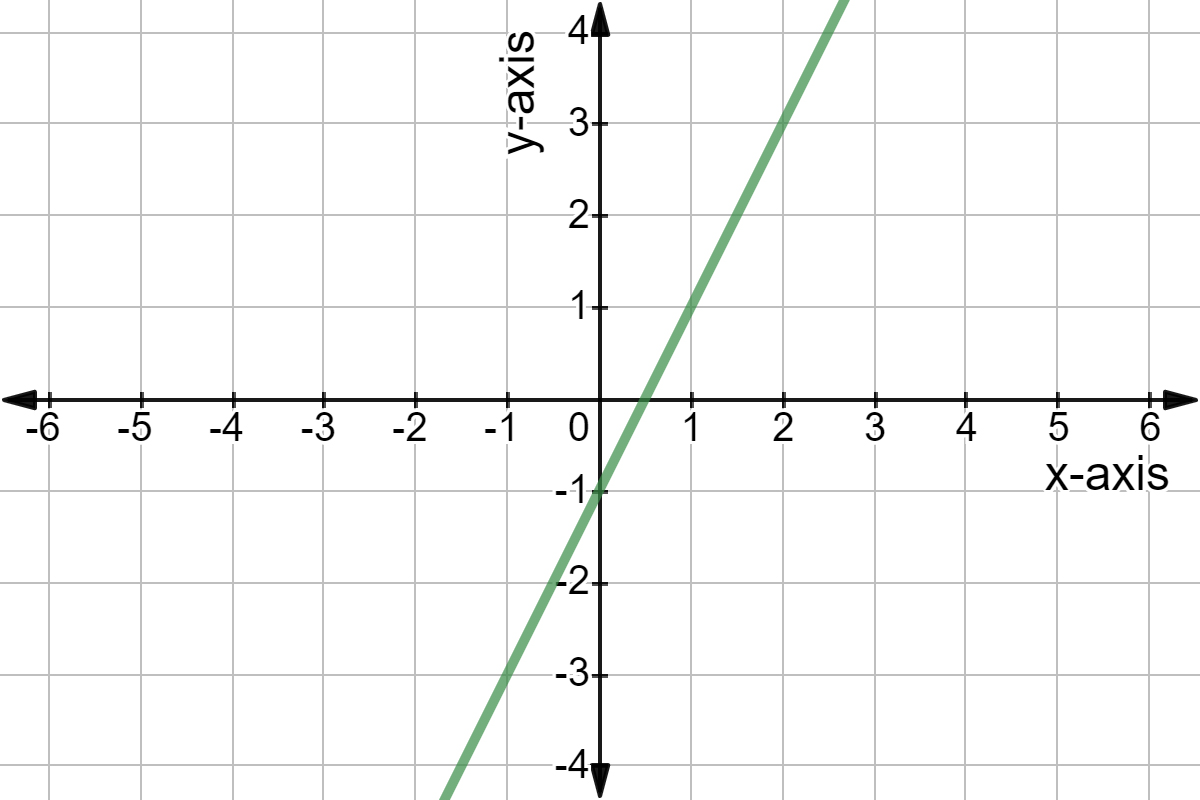
In general, the graph of a function contains all the points that satisfy the equation of the function.

Ready to see an example?

Have a look at this: f(x)=2x−1f(x)=2x-1

Which of the following points satisfy this equation?

Choose all correct answers

Illustrated · 1 min

Function Graphs

Here is a list of some basic functions and their corresponding graphs. Once you are familiar with graphing functions, you can start to solve systems of equations (like linear or linear-quadratic systems) using graphing!

Linear

f(x)=xf(x)=x

Graph of y = x

Made using Desmos

Quadratic

f(x)=x2f(x)=x^2

Graph of y = x^2

Made using Desmos

Cubic

f(x)=x3f(x)=x^3

Graph of y = x^3

Made using Desmos

Square Root

f(x)=xf(x)=\sqrt{x}

You can learn more about square root functions here.

Graph of y = sqrt(x)

Made using Desmos

Cube Root

f(x)=x3f(x)=\sqrt[3]{x}

Graph of y = x^3

Made using Desmos

Absolute Value

f(x)=∣x∣f(x)=|x|

You can learn more about absolute value expressions here.

Graph of y = |x|

Made using Desmos

Reciprocal

f(x)=1xf(x)=\frac{1}{x}

Graph of y = 1/x

Made using Desmos

Natural Logarithmic

f(x)=ln⁡xf(x)=\ln x

Graph of y = ln(x)

Made using Desmos

Exponential

f(x)=exf(x)=e^x

Graph of y = e^x

Made using Desmos

Cosine

f(x)=cos⁡xf(x)=\cos x

Graph of y = cos x

Made using Desmos

Sine

f(x)=sin⁡xf(x)=\sin x

Graph of y = sin x

Made using Desmos

Tangent

f(x)=tan⁡xf(x)=\tan x

Graph of y = tan x

Made using Desmos

It's possible you haven't seen some of these graphs before - that's okay! This is a basic overview of many of the functions you'll see in the future as you continue on your math journey!

Video · + 1 min read

(Video) Introduction to Graphing Quadratic Equations

by Garret Cahill

In this video, Garret discusses how to graph quadratic functions. Before looking at this video, take a look at how to graph linear functions.

Summary\large{\text{Summary}}

The equation of a quadratic is y=a(x−h)2+ky=a(x-h)^2+k When we graph the function f(x)=x2f(x)=x^2, we get the basic parabola with the vertex at the origin.

Quadratic function y = x^2.

Made using Desmos

When you have f(x)=(x−h)2f(x)=(x-h)^2 the graph moves right hh units.

Quadratic function's horizontal shift of h.

Made using Desmos edited by Alex

When you graph f(x)=a(x−h)2f(x)=a(x-h)^2 the values of the graph increase, with the vertex remaining the same.

Quadratic function's compression of a.

Made using Desmos edited by Alex

When you graph f(x)=a(x−h)2+kf(x)=a(x-h)^2+k the graph moves kk units. The vertex is always (h,k)(h,k).

Quadratic function's vertical shift of k.

Made using Desmos edited by Alex

The video then talks about xx-intercepts which are where the graph crosses the xx-axis. The line of symmetry is the line which the parabola is symmetric over.

When you are given a quadratic equation to graph in standard form, you can use the intercepts to plot the graph. You just have to plug in 00 for yy to find the xx-intercepts and plug in 00 for xx to find the yy-intercept.

Type a concept, like “slope” or “photosynthesis”.

↑ ↓ to choose · Enter to openSearch explanations and problems