Interactive · 1 question

+1 contributors

How to Graph a Sine Function

Image by Geek3 via Wikimedia Commons
The graph above shows one period of a sine wave. We know that the period is equal to , since the sine wave will repeat every units.

Image by Kraaiennest via Wikimedia Commons
Above, we have a sine wave that extends further than . We also have a few more identifiers we need to define.
: Pronounced "lam-duh": This is the wavelength of the sine wave. This is the distance between each crest (or tip) of the wave.
: Amplitude: This is the height of each wave. More technically, it is the measure of deviation from its central value. This value is always positive.
Let's take a look at how we can affect our and values!

Made using Desmos
Pictured above, we have a typical sine wave. This would be written as . I used because sine is a function of some number . Now, let's see what happens if we make it .

Made using Desmos
Notice the change in our (amplitude) value! By putting a value in front of the , we changed the graph by that factor (i.e. multiplied to get the new amplitude)
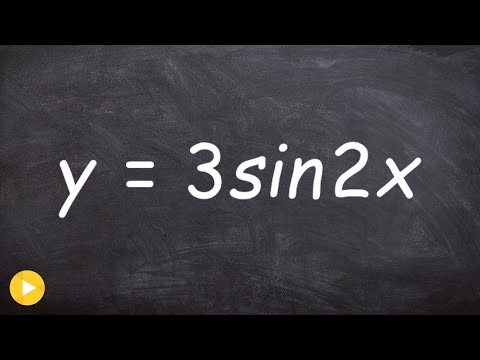
What is the amplitude of ?
Great! Now let's look at how we could change (wavelength).
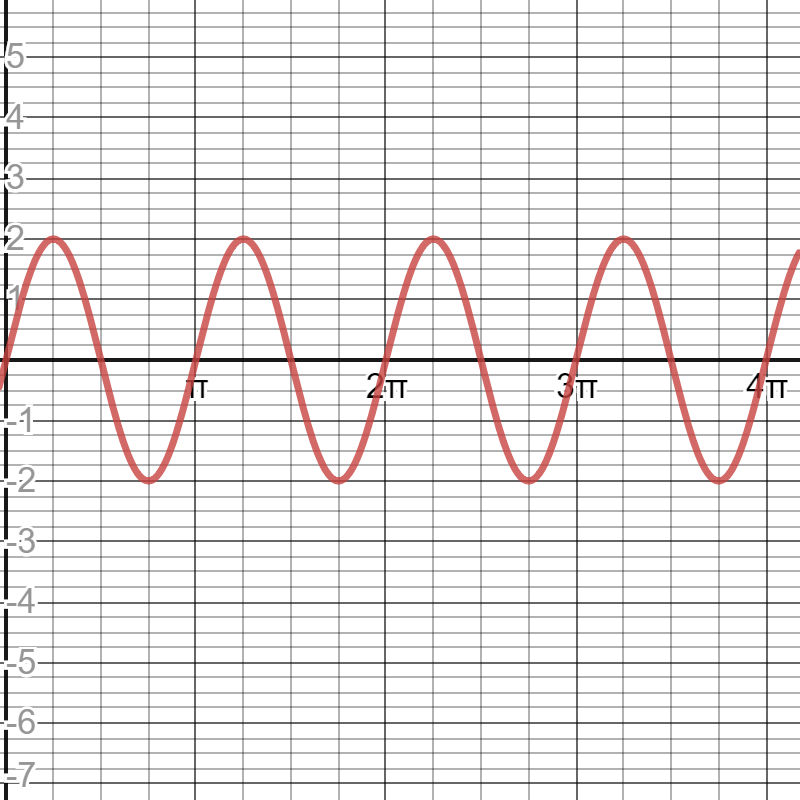
If we have a function defined as , this will look like:
Made using Desmos
Notice how we will now have full waves in the same period! Since the sine wave is cycling twice as fast, so the period is only half as long! In this case, the period of the graph is .