দ্বিঘাত সমীকরণের গ্রাফ:$y=ax^2$

Before this, knowদ্বিঘাত ফাংশন কি?

Illustrated · 2 min

All quadratic functions have the form

y=ax2+bx+c,y = ax^2 + bx + c,

where a,b,ca, b, c are real numbers. If any of them are zero, one of the terms goes away.

If a=0,a = 0, then y=bx+c.y = bx + c. If b=0,b = 0, then y=ax2+c.y = ax^2 + c. If c=0,c = 0, then y=ax2+bx.y = ax^2 + bx.

The problem with a=0a = 0 is that there is no longer a quadratic term. This makes the function linear.

We can make the most basic quadratic function by making bb and cc BOTH equal zero. This minimizes the number of terms. We are left with:

y=ax2y = ax^2

Let's dive into this.

For parabolas, we care most about two things:

  1. Where is the parabola's vertex?

  2. Does the parabola point upward or downward?

We will talk about Question 2 first. The direction of the parabola only depends on whether aa is positive or negative.

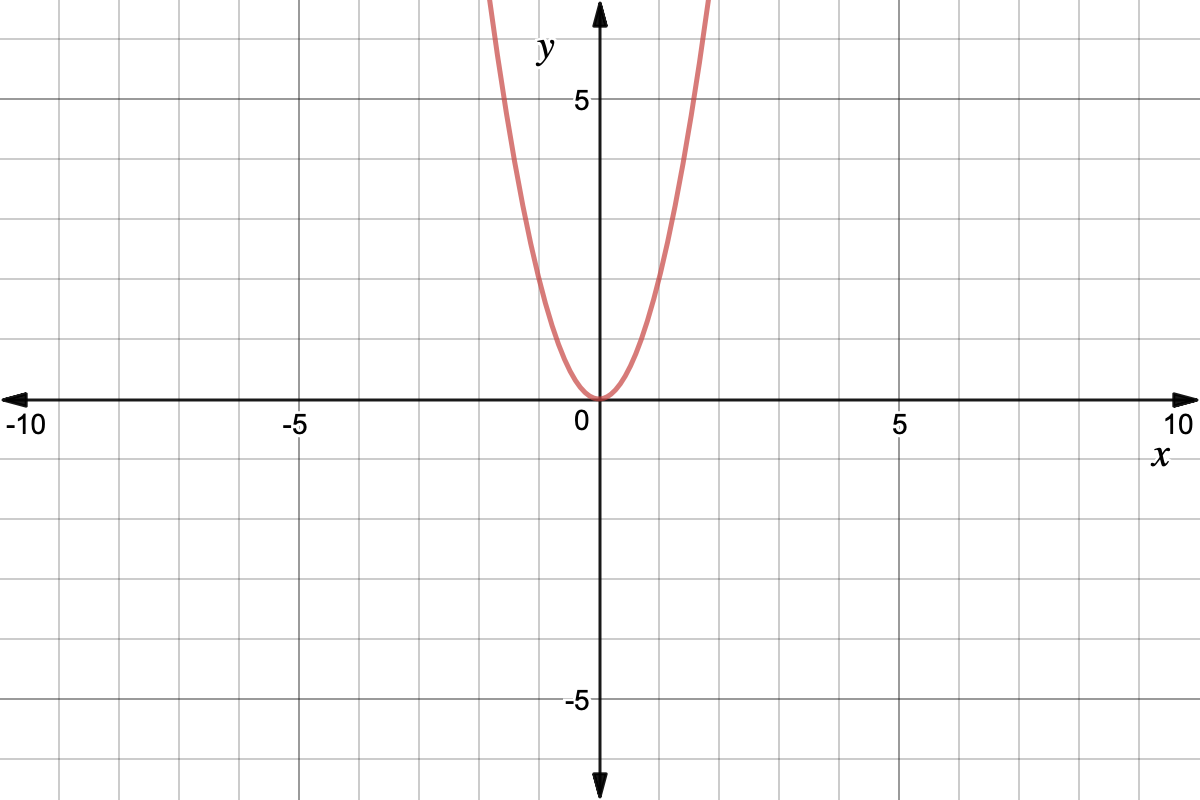
If aa is positive, the parabola points upward. For example, consider this graph of y=2x2y = 2x^2 (a=2a = 2 here):

Graph of the function y = 2x^2

Graph courtesy of Desmos

The graph suggests that y=ax2y = ax^2 is never negative. We can demonstrate this with some algebra.

If x=0,x = 0, then

y=a(0)2=a(0)=0,y = a(0)^2 = a(0) = 0,

regardless of what aa is. If xx is nonzero, then x2x^2 is positive (try checking this for your favorite nonzero numbers). If aa is positive, then yy is just the product of two positive numbers, aa and x2x^2. This means yy is positive whenever x≠0.x \neq 0.

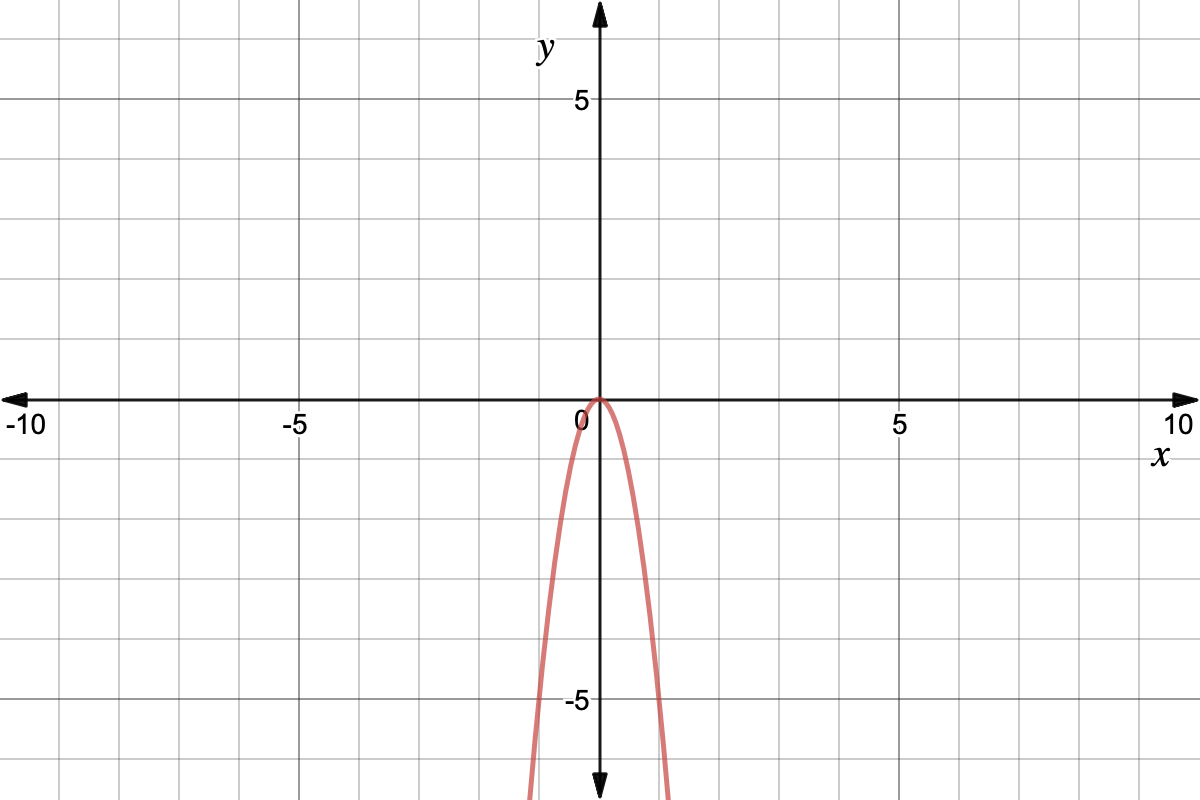
We do almost the same thing if aa is negative rather than positive. Let's look at y=−5x2y = -5x^2 as an example (in this case a=−5a = -5).

Graph of y = 5x^2

Graph courtesy of Desmos

Now we will explain why yy is never positive if aa is negative. If x=0x = 0 then

y=ax2=a(0)2=a(0)=0,y = ax^2 = a(0)^2 = a(0) = 0,

and now we are left with considering what happens if x≠0.x \neq 0. The value of x2x^2 is positive for any nonzero x,x, so yy is a product of a negative number and a positive number. Therefore yy must be negative.

Now we're going to talk about the vertex. The vertex is the "high point" of the parabola if it points downwards, and the "low point" of the parabola if it points upwards.

Did you notice how x=0x = 0 has "special" behavior on the parabola regardless of whether aa was positive or negative? Well, there's a reason for that. If aa is negative, then y=ax2y = ax^2 is zero at x=0x = 0 and negative everywhere else. Thus yy will be as big as possible if x=0,x = 0, so this will be the vertex.

If aa is positive, then y=ax2y = ax^2 is zero at x=0x = 0 and positive everywhere else. Thus yy will be as small as possible if x=0,x = 0, so this will be the vertex.

Here is a brief summary.

  1. The "simplest" quadratic functions are those that look like y=ax2y = ax^2.

  2. If a>0,a > 0, the parabola points upwards.

  3. If a<0,a < 0, the parabola points downwards.

  4. x=0x = 0 is the vertex of any parabola of the form y=ax2y = ax^2.

Interactive · 1 question

The standard form of a quadratic function is the following:

y=ax2+bx+cy = ax^2+bx+c

xx represents an unknown variable, aa, bb, and cc are constants, and a≠0a\ne 0. When b=0b= 0 and c=0c= 0, the quadratic function is of the form

y=ax2y = ax^2

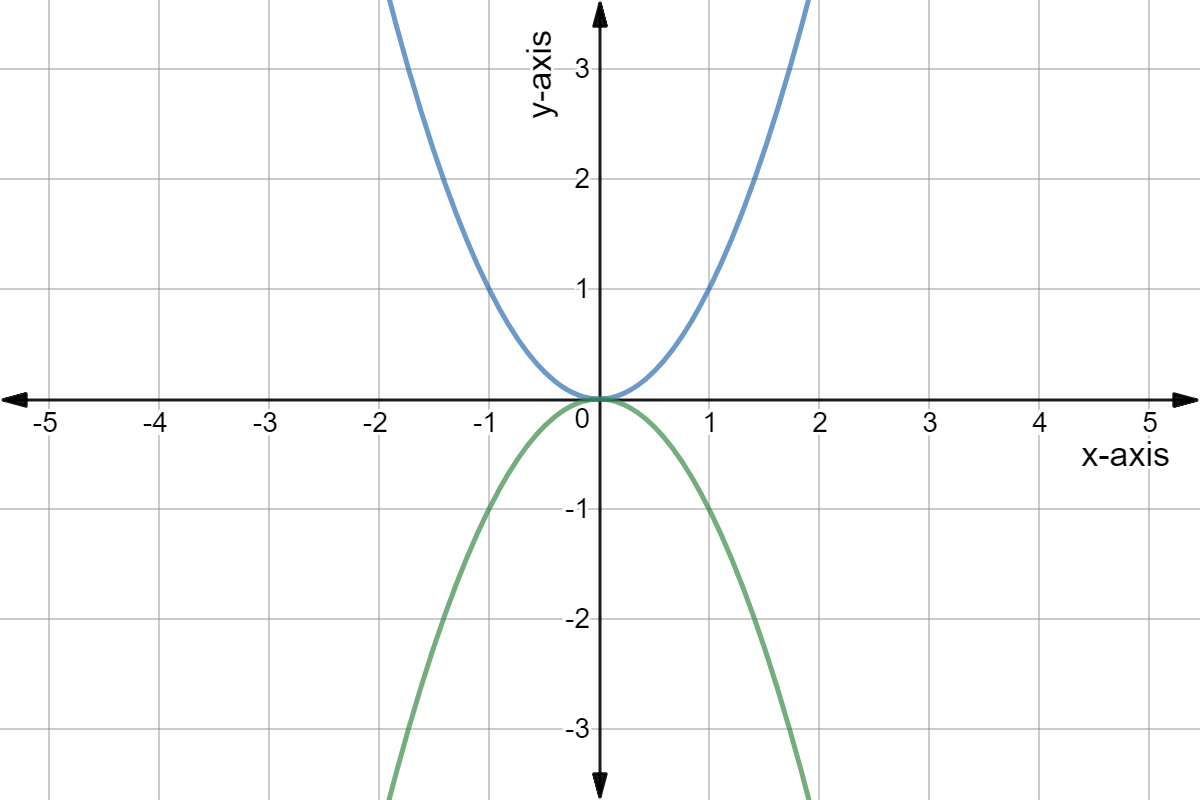
The graph y=ax2y = ax^2 takes the shape of a parabola. The sign of aa determines where the graph would be located. When a>0a>0, the parabola is located above the xx-axis. When a<0a<0, the parabola is located below the xx-axis. y=ax2y = ax^2 and y=−ax2y = -ax^2 are symmetric about the xx-axis.

Graphed below are the function y=x2y = x^2 (in blue) and y=−x2y = -x^2 (in green).

Graph of quadratic functions y = x^2 and y = -x^2.

Made using Desmos

The coefficient aa determines the concavity of the parabola (how wide or thin the parabola is). Concavity corresponds with the rate that a parabola opens.

When ∣a∣>1\left|a\right| > 1, the parabola is thinner because the function is increasing at a faster rate. For example, take the two functions f(x)=2x2f(x) = 2x^2 and g(x)=x2g(x) = x^2. f(1)>g(1)f(1) > g(1), which shows that f(x)f(x) increases at a higher rate.

When ∣a∣<1\left|a\right| < 1, the parabola is wider because the function is increasing at a slower rate (or decreasing at a faster rate). For example, take the two functions f(x)=12x2f(x) = \frac{1}{2}x^2 and g(x)=x2g(x) = x^2. f(1)<g(1)f(1) < g(1), which shows that f(x)f(x) increases at a lower rate.

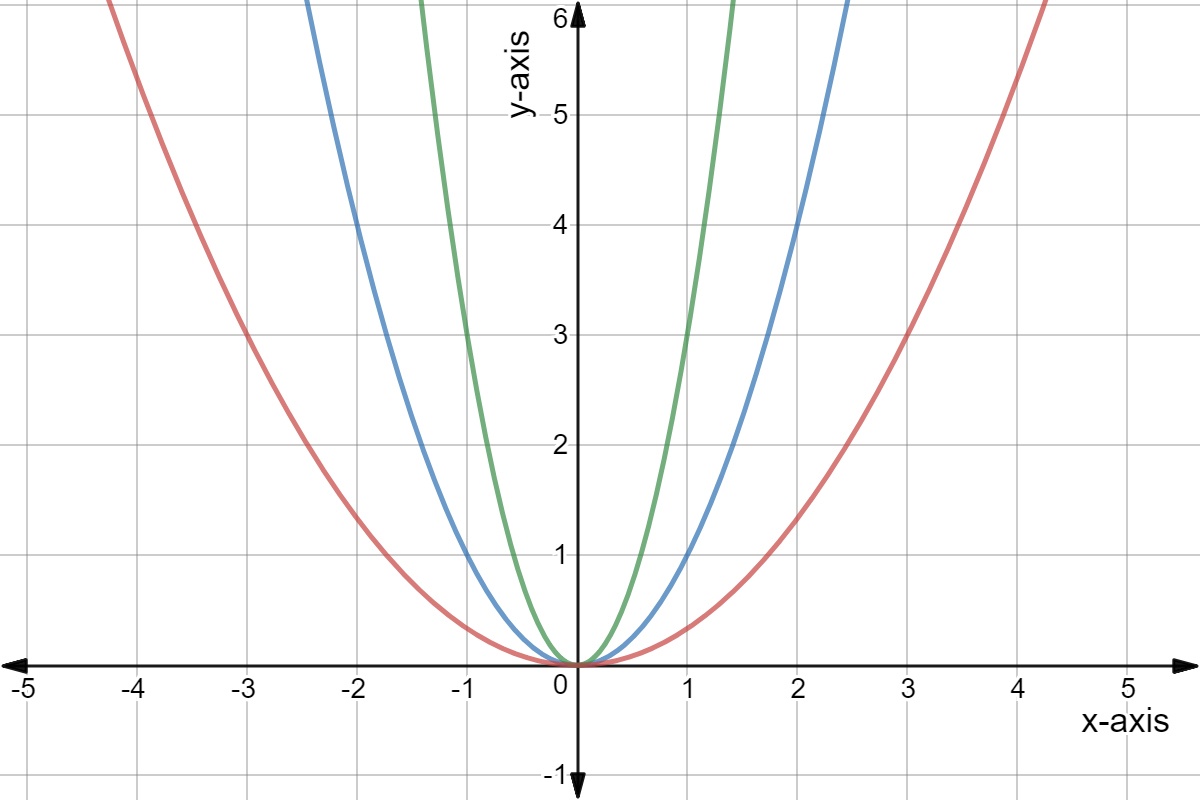
Graphed below are the function y=x2y = x^2 in blue, y=3x2y = 3x^2 in green, and y=13x2y = \frac{1}{3}x^2 in red.

Quadratic graphs of y = x^2, y = 3x^2, and y = 1/3x^2

Made using Desmos

Which parabola is the graph of the function y=13x2y = \frac{1}{3}x^2 ?

Choose one answer

Video · + 1 min read

(Video) Algebra 2 4-1 Quadratic Functions and Transformations: Problem 1 - Graphing f(x)=ax2f(x) = ax²

by Matthew Richardson

This video by Matthew Richardson discusses the graph of f(x)=ax2f(x)=ax^2.

Summary\large{\text{Summary}}

Every quadratic has the form y=ax2+bx+c,y=ax^2+bx+c, where a,b,a, b, and cc are constants and a≠0a \neq 0 . Each coefficient in the equation gives us information about the graph of the parabola. There are values such as the vertex and axis of symmetry that need the bb and cc values. We're going to focus on information we can get when there is only the quadratic term, ax2ax^2.

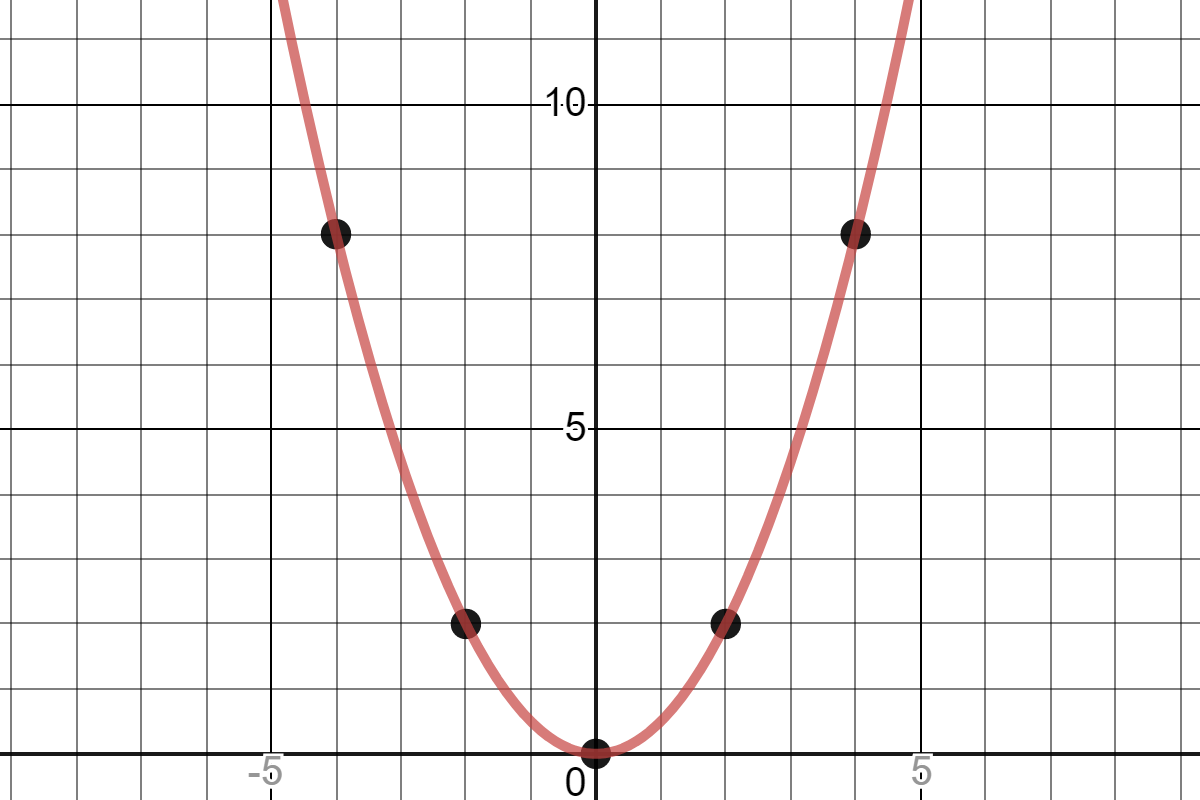
Matthew looks in detail at the function f(x)=12x2f(x)=\frac12 x^2. We can start by plugging numbers into the function and finding the output.

xf(x)=12x2(x,f(x))012(0)20212(2)22412(4)28−212(−2)22−412(−4)28\begin{array}{|l|c|r|} \hline x & f(x)=\frac12 x^2 & (x,f(x))\\ \hline 0 & \frac12 (0)^2 & 0\\ \hline 2 & \frac12 (2)^2 & 2\\ \hline 4 & \frac12 (4)^2 & 8\\ \hline -2 & \frac12 (-2)^2 & 2\\ \hline -4 & \frac12 (-4)^2 & 8\\ \hline \end{array}

Let's look at these points on a graph.

The Parabola has the points (0,0) (2,2) (4,8) (-2,2) and (-4,8).

Made with Desmos

We can already see the parabolic shape. Moving from left to right, the graph goes downward until (0,0)(0,0), then goes upwards. Let's connect these points.

Graph of the parabola f(x)=1\2 x^2

Made with Desmos

There's our parabola!

He brings up a question in the end that is never answered.

What can you say about the graph of the function f(x)=ax2f(x)=ax^2 if aa is a negative number?

A negative aa value flips the graph vertically. We have the graph of f(x)=12x2f(x)=\frac12 x^2 above, so let's look at the graph of f(x)=−12x2f(x)= -\frac12 x^2.

This parabola faces downward.

Made with Desmos

We see the points (0,0),(−2,−2),(2,−2),(−4,−8),(0,0), (-2,-2), (2,-2), (-4,-8), and (4,−8)(4,-8). This means the parabola opens downward rather than upward.

Type a concept, like “slope” or “photosynthesis”.

↑ ↓ to choose · Enter to openSearch explanations and problems