
Interactive · 2 questions
+2 contributors


When a line is straight, we can say that its rate of change is constant, that it's the same between any two points on the line.

Graph of
made using Desmos
We can see that the straight line doesn't increase or decrease any faster or slower at any point. It's always increasing or decreasing at the same rate.
With quadratic equations, the graphs are in the shape of parabolas (U-shapes). In the case of parabolas, the rate of change isn't constant. Take a look:

Graph of
made using Desmos
Notice how the parabola doesn't increase or decrease at the same rate over the whole graph. So, we need a way to calculate the rate of change for a quadratic expression.
Let's talk about it :)
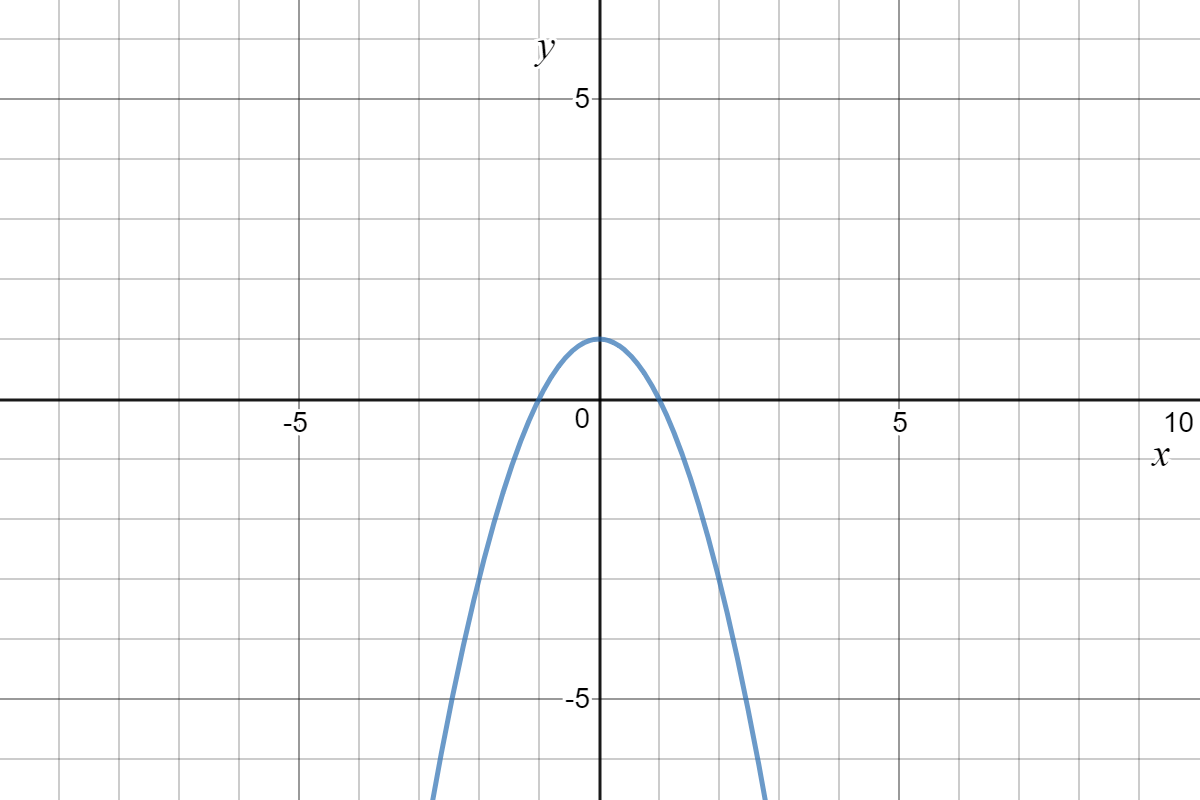
Graph of
made using Desmos
Consider the graph above. Does it show a constant rate or change or not?
Below, you'll see the formula we'll be using to find the rate of change between any two points on a parabola.
Here's a breakdown of what all those letters mean:
= -value on parabola
= another -value on parabola
= what you get when you plug in "" for "" in the original expression
= what you get when you plug in "" for "" in the original expression
Let's look at an example, so we can see this formula in action. We'll base our example on the quadratic expression and its graph below:
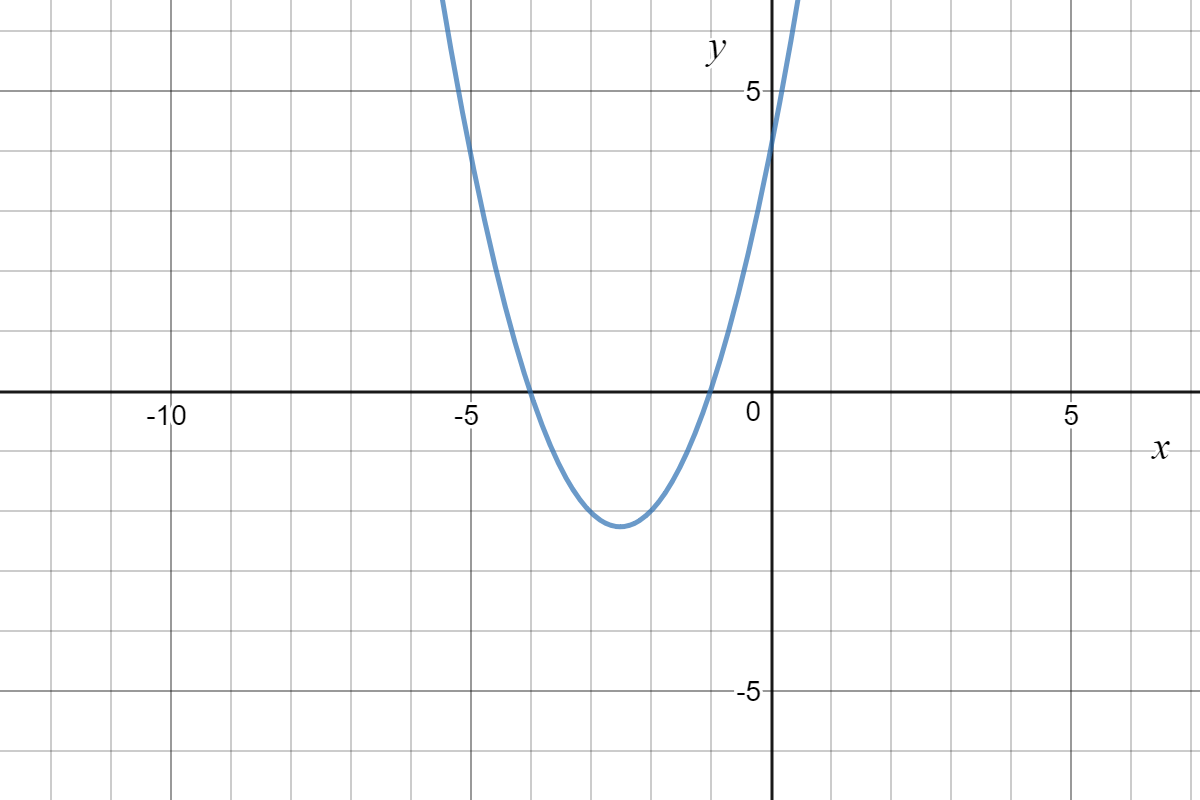
Graph of
made using Desmos
*Let's say that we're curious about the rate of increase between and . *(Just to make those points clear, we've marked them in pink on the graph above).
Now, let's make a key for the values , , , and in the formula:
(see below for how we got this value)
(see below for how we got this value)
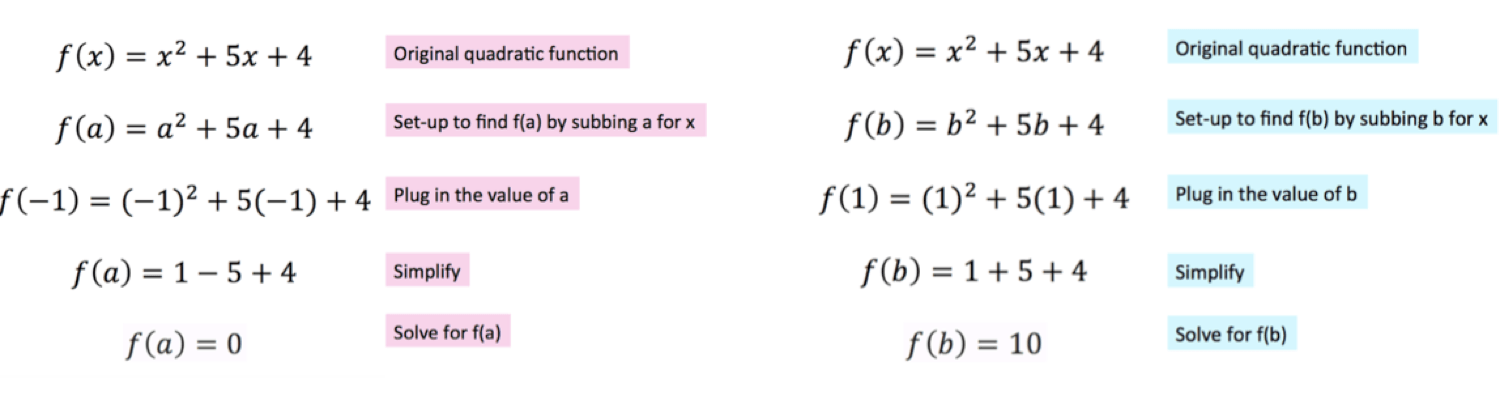
Now, let's plug in the values for , , , and into our rate of change equation:
Once you plug in these values, what is the rate of change for this expression?
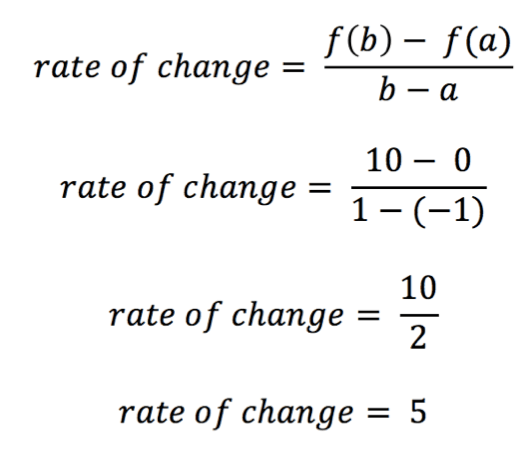
And that's it! We've calculate the rate of increase between and on the graph of our quadratic expression. If we picked a different range of values, our answer would almost certainly be different.


