Illustrated · 1 min

+2 contributors


What is a Residual Plot?
Simply put, it is a graph showing all the residual values from your scatter plot.
How to Create One
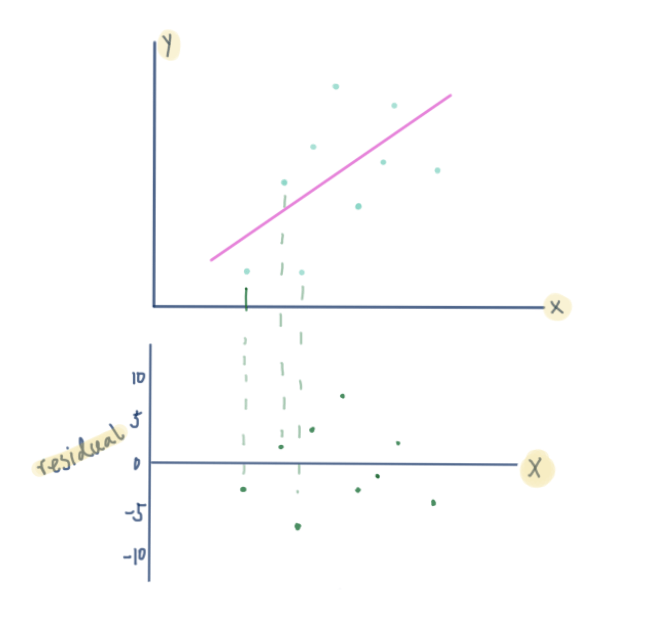
To begin, suppose we have a standard scatter plot and a trend line.

We first want to calculate the residual of each point of data on the scatter plot. Recall the equation for a residual:
Next, we plot the residual values on their own graph. The -coordinate stays the same and the -coordinate is the residual value.

Voilà!
That's Cool but What Does This Tell Us?
Don't worry, there is a use for this. Residual plots actually tell us whether or not the model we used for a trend line is a good fit.
If our plot has a random scattering of points, like in the graph above, it tells us that a linear model is a good choice for the data. In other words, since the plot shows no pattern, we know that a straight line will represent the data the best.
If the residuals take on a pattern like a U-shape or upside-down-U-shape, then this tells us a nonlinear equation fits our model better. This could be a quadratic function for example.

Here's an example of a residual plot with a U-shaped pattern. This tells us a nonlinear model with fit the scatter plot's data better.