রৈখিক ও দ্বিঘাত সমীকরণ সমাধানের পদ্ধতি: গ্রাফ

Interactive · 1 question

Graphing Linear-Quadratic Systems

A system of equations is made up of two or more equations. We work with linear and/or quadratic systems. This is an example of a system of linear equations:

{y−12x=33x−y=7\begin{cases} y-\frac12x =3\\ 3x-y=7 \end{cases}

There are many ways to solve systems of equations. One way is by graphing the equations in the system and seeing where they intersect. To graph these equations, we want to put them in slope-intercept form, y=mx+by = mx+b:

y=12x+3y=3x−7\begin{matrix}y=\frac{1}{2}x+3\\ y=3x-7 \end{matrix}
Graph of y = 0.5x + 3 and y = 3x - 7.

Created on Desmos

y=12x+3y=\frac{1}{2}x+3 is in red and y=3x−7y=3x-7 is in blue. The solution of the system is the point where the lines intersect: (4,5).(4, 5).

Linear systems are fairly simple to graph and solve. We can use the same techniques to solve linear-quadratic systems! Take a look at the following system of equations:

{y=x2+3x−2y=x−2\Bigg\{ \begin{align} y &= x^2+3x-2\\ y &= x-2 \end{align}

Let's graph these equations to see what happens!

Quadratic graph of y = x^2 + 3x - 2 and linear graph of y = x - 2.

Created on Desmos

There are two points where the parabola y=x2+3x−2y = x^2+3x-2 and the line y=x−2y = x-2 intersect: (0,−2)(0, -2) and (−2,−4)(-2, -4). This linear-quadratic system of equations has two solutions: (0,−2)(0, -2) and (−2,−4)(-2, -4).

Let's try another example. Take a look at this system of equations:

{y=x2+2y=2\Bigg\{ \begin{align} y &= x^2+2\\ y &= 2 \end{align}

Time to graph!

Quadratic graph of y = x^2 + 2 and linear graph y = 2.

Created on Desmos

There's only one point where the parabola y=x2+2y = x^2+2 and the line y=2y = 2 intersect: (0,2).(0, 2). So, this linear-quadratic system of equations has one solution: (0,2).(0, 2).

Time for one last example!

Using your graphing skills, what is the solution of the following linear-quadratic system of equations?

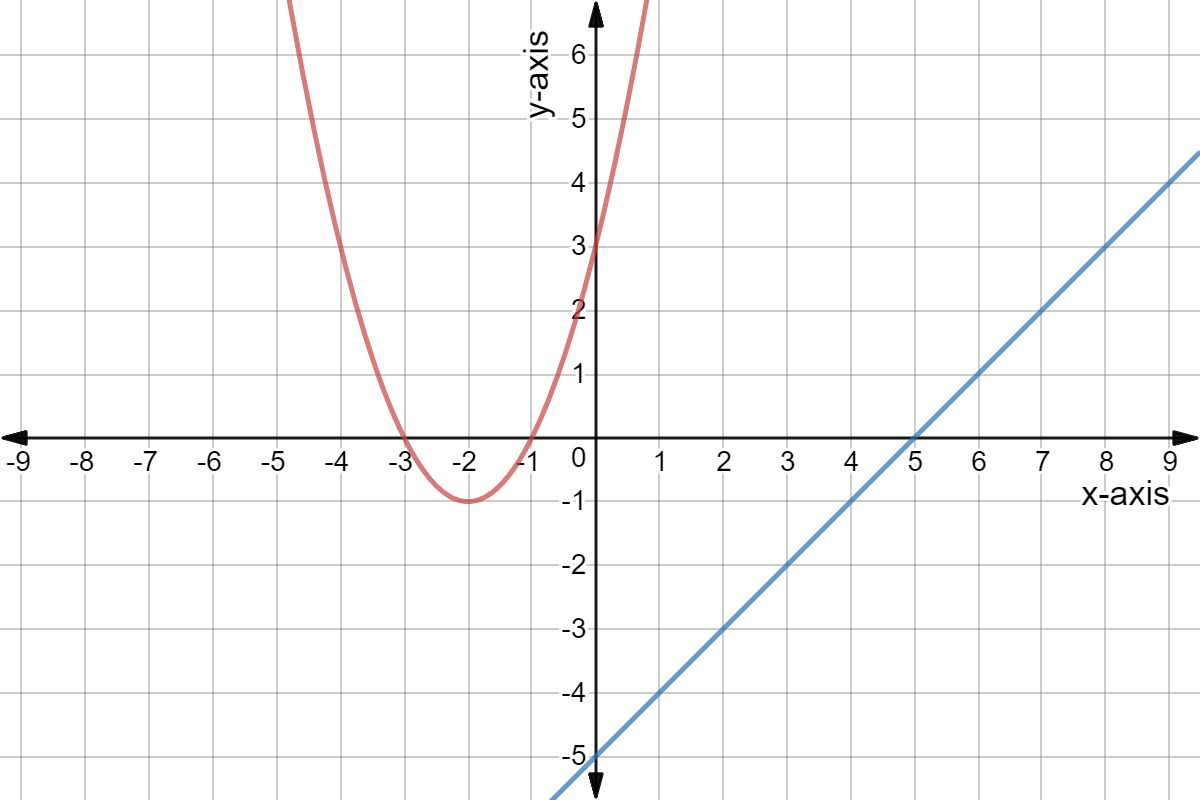
{y=x2+4x+3y=x−5\Bigg\{ \begin{align} y&=x^2+4x+3\\ y &= x-5 \end{align}
Choose one answer

Interactive · 3 questions

Linear-Quadratic Systems of Equations

A system of equations is "two or more equations that have the same variables with the same values."

You've probably already worked with linear systems of equations (systems in which all of the equations are linear). The cousin of linear systems is called the linear-quadratic system of equations.

Linear-quadratic systems of equations contain both linear and quadratic equations. Recall that a quadratic equation will have the form: ax2+bx+cax^2 + bx + c where a,b,a, b, and cc are constants and a≠0.a \neq 0.

There are a few ways to solve linear-quadratic systems, like elimination and substitution, but in this explanation, we will focus on graphing. Linear equations can be graphed as straight lines, while quadratic equations can be graphed as parabolas (U-shapes).

We can find the solutions (the values of the variables xx and yy) by identifying the point(s) on the graph where the line and parabola intersect.

Let's take a look!

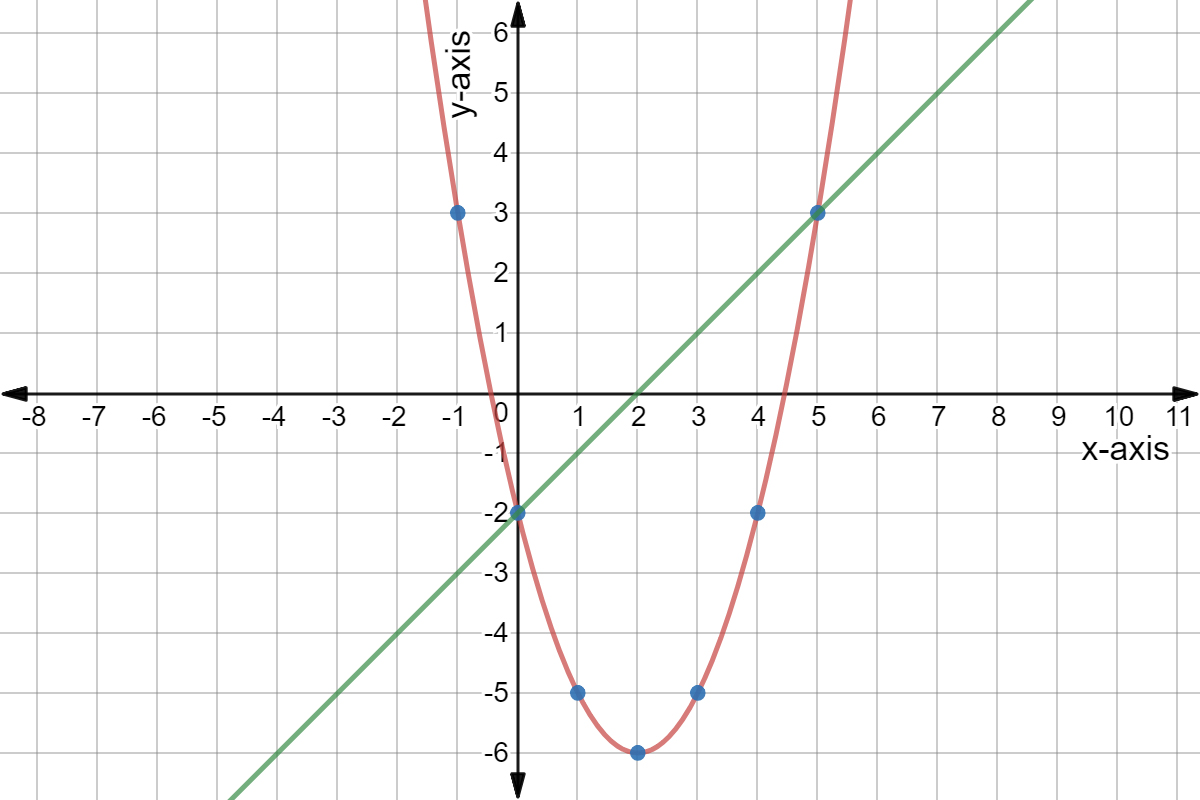
y=x2−4x−2      (quadratic equation)y=x−2      (linear equation)\begin{align}y = x^2 - 4x - 2 &\,\,\,\,\,\,\text{(quadratic equation)}\\ y = x - 2 &\,\,\,\,\,\,\text{(linear equation)}\end{align}

Let's start by graphing the quadratic equation. The easiest way to do this is to create a table of xx-values, and then find their corresponding yy-values by plugging them into the equation. We can then graph those points.

xy−130−21−52−63−54−253\begin{array}{c | c} x & y \\ \hline -1 & 3 \\ 0 & -2 \\ 1 & -5 \\ 2 & -6 \\ 3 & -5 \\ 4 & -2 \\ 5 & 3 \end{array}
Quadratic graph of y = x^2 - 4x - 2.

Plot the points, then connect the dots to make a parabola (U-shape)! Created on Desmos

Now, let's add the linear equation to the graph.

Recall that linear equations are in the form y=mx+by=mx+b, where mm is the slope and bb is the yy-intercept (where the line crosses the yy-axis).

The linear equation in our system is y=x−2y=x-2.

What is the slope of this line?

Choose one answer

Video · + 1 min read

(Video) Systems of Linear and Quadratic Equations

by Chris Rotolo

This video by Chris Rotolo covers systems with linear and quadratic equations.

Summary\large{\text{Summary}}

Solving quadratic-linear systems of equations can be done multiple ways. One way is to graph the parabola and the line from the equations on a set of axes. You can do this using a graphing calculator or another tool!

As Chris Rotolo says in the video, there are three possible types of solutions when you are solving a linear-quadratic system of equations, all depending on the points of intersection.

Two Solutions

In this case, the line intersects the parabola at two distinct points, like in the picture below. There are two real solutions!

Graph of a parabola and a line that intersects the parabola at two distinct points

Created on Desmos

One Solution

In this case, the line intersects the parabola at one distinct point, like in the picture below. There is one real solution!

Graph of a parabola and a line that intersects the parabola at one distinct point.

Created on Desmos

No Solution

In this case, the line and the parabola do not intersect at any point. There are no real solutions!

Graph of a parabola and a line that do not intersect

Created on Desmos

Type a concept, like “slope” or “photosynthesis”.

↑ ↓ to choose · Enter to openSearch explanations and problems