Grafik

Before this, knowProperti

Interactive · 1 question

How to Graph a Cosine Function

Graph of cos(t)

Made using Desmos

The graph above shows one period of a cosine wave. We know that the period is equal to 2π2\pi, since the sine wave will repeat every 2π2\pi units.

Image by Pelegs via [Wikimedia Commons](https://commons.wikimedia.org/wiki/File:Wave_new.svg)

Image by Pelegs via Wikimedia Commons

Above, we have a sine wave that extends further than 2π2\pi. We also have a few more identifiers we need to define.

λ\lambda: Pronounced "lam-duh": This is the wavelength of the sine wave. This is the distance between each crest (or tip) of the wave.

AA: Amplitude: This is the height of each wave. More technically, it is the measure of deviation from its central value. This value is always positive.

Let's take a look at how we can affect our AA and λ\lambda values!

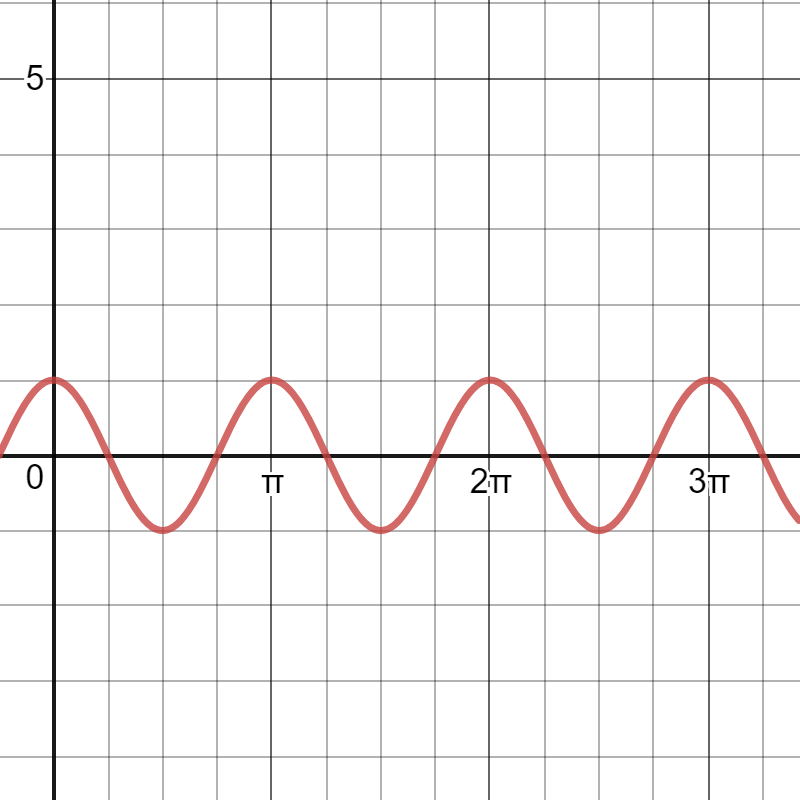
Graph of cosine

Made using Desmos

Pictured above, we have a typical cosine wave. This would be written as f(t)=cos⁡(t)f(t) = \cos(t). I used f(t)f(t) because cosine is a function of some number tt. Now, let's look at what happens if we make it f(t)=2cos⁡(t)f(t) = 2\cos(t).

Graph of 2 cos(t)

Made using Desmos

Notice the change in our AA (amplitude) value! By putting a value in front of the cos⁡\cos, we changed the graph by that factor (i.e. multiplied 1×21 \times 2 to get the new amplitude)

What is the amplitude of y = 4 cos(x - 3)?

Choose one answer

Video

(Video) Graphing a Trig Function with Cosine

by Brian McLogan

In this video by Brian McLogan, you will learn how to graph cosine functions.

Summary

Graph the following trig function: f(x)=2 cos (2x)f(x) = 2 \text{ cos }(2x).

We know that the general form of the cosine function is f(x)=a cos (bx−c)+df(x)=a \text{ cos }(bx-c) +d

That means that the amplitude of our function is ∣2∣=2|2|=2.

The period is 2πb=2π2=π\frac{2\pi}{b} = \frac{2\pi}{2} = \pi.

Now, we can graph the cosine function! Since the amplitude is 22, the distance from the xx-axis to the highest point is 22, and the distance from the xx-axis to the lowest point is 22.

The period is π\pi, so halfway is π2\frac{\pi}{2}. Our graph looks like:

Graph of y=2cos(2x)

Made using Desmos

Illustrated · 1 min

Cosine Graphs

In the previous lessons on trigonometric functions, we looked at the sine graph. The sine and cosine functions look very similar, except the cosine function has a horizontal shift (not a vertical shift). The amplitude and period of the sine and cosine functions are the same.

When graphing the parent cosine function graph, there are a few key points to keep in mind that will make it easier to graph the cosine function!

Cosine graphs

Image source: by Anusha Rahman

The peak is the highest point of a periodic function, and the trough is the lowest point. The length from peak to peak is the period (or the length from trough to trough).

For a parent cosine graph,

  • The amplitude (the distance from the midline to the trough/peak) is 11.

  • The period is 2π2\pi.

  • The xx-intercepts are π2\frac{\pi}{2} and 3π2\frac{3\pi}{2}.

  • The yy-intercept is at y=1y=1.

The equation for the general formula for the cosine function is:

cos⁡(α)=cos⁡(α+2kπ),k∈allintegers\cos(\alpha) = \cos(\alpha + 2k\pi), k \in all \hspace{0.25cm} integers

Looking Further

Now that you've mastered the basics of graphing, you are ready to learn about translating cosine functions!

Type a concept, like “slope” or “photosynthesis”.

↑ ↓ to choose · Enter to openSearch explanations and problems