Illustrated · 1 min
+3 contributors


Linear Functions
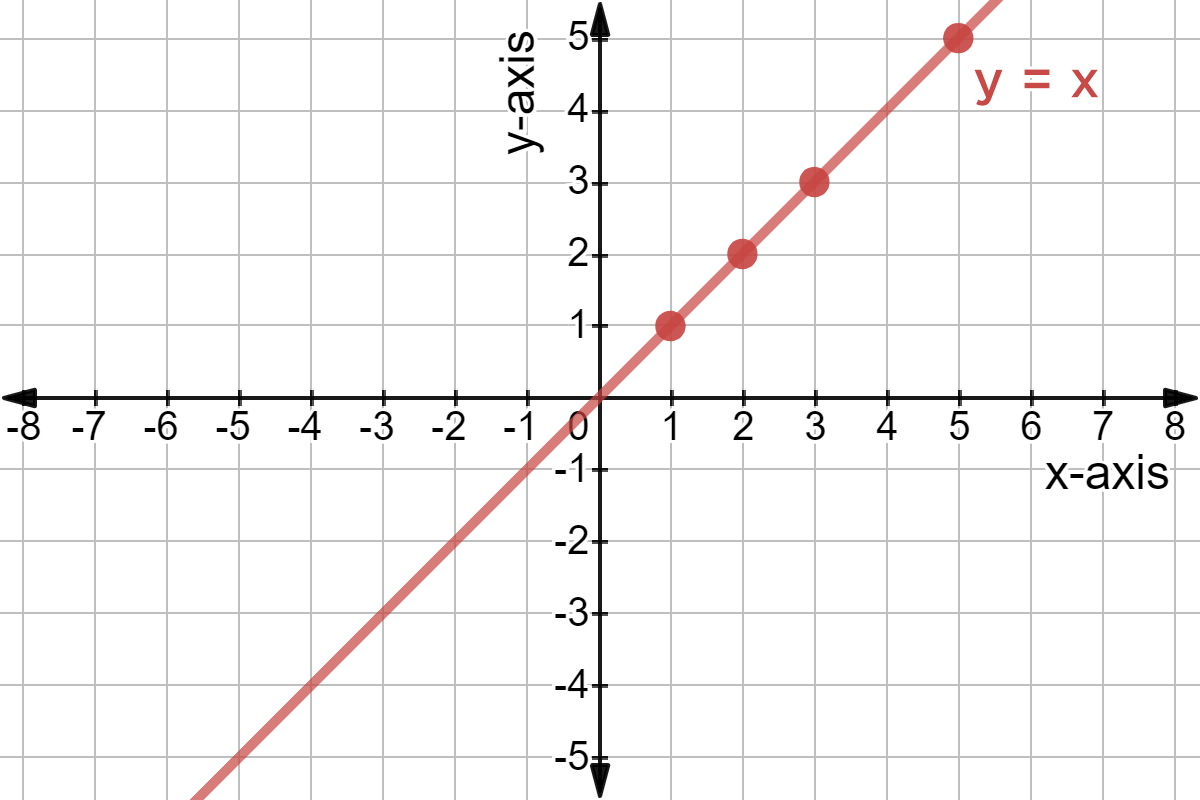
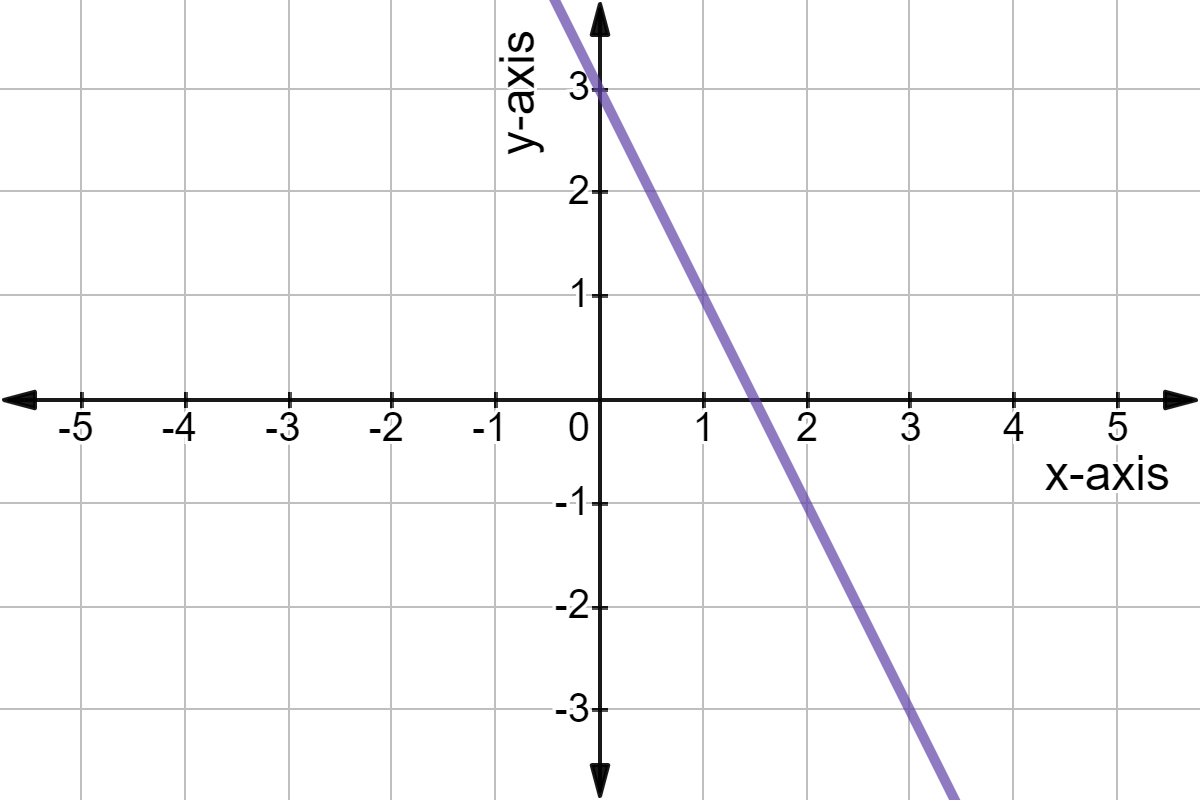
The name "linear functions" has the word "line" in it, which would suggest that, graphically, linear functions would look like lines.
And indeed they do. Here is a graph of:
Made using Desmos
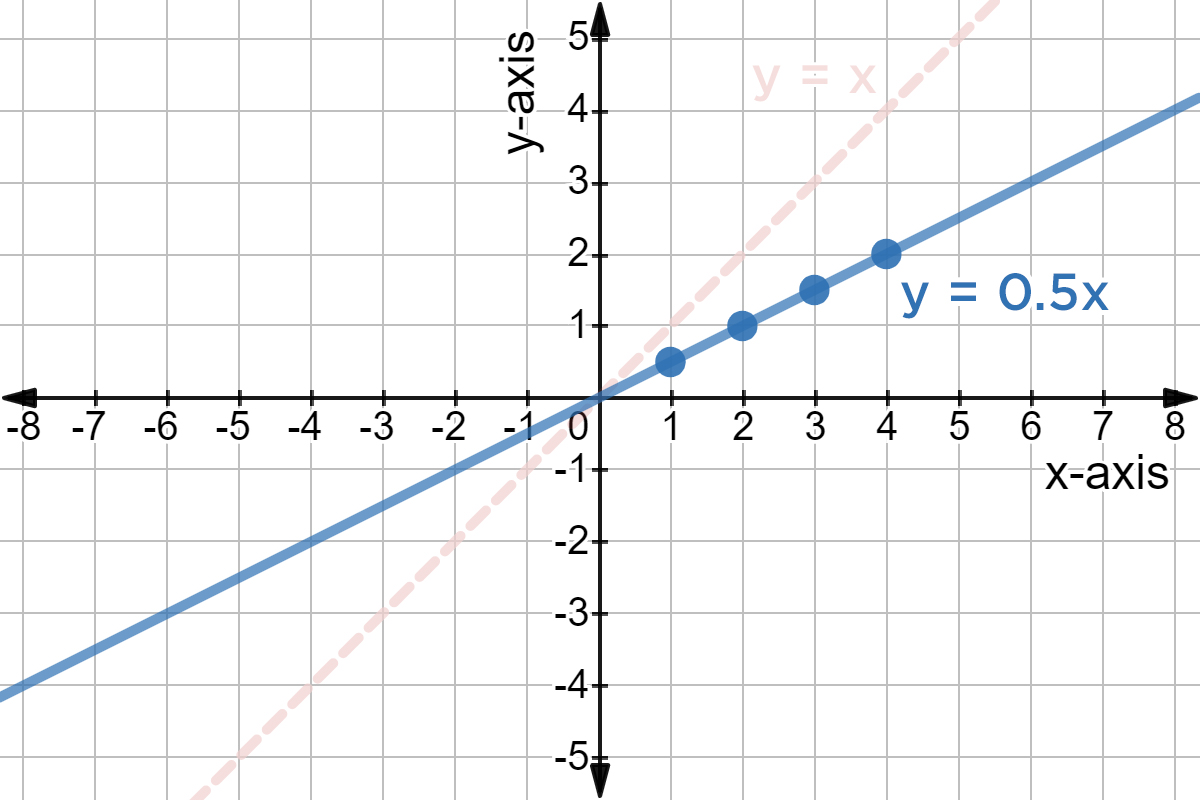
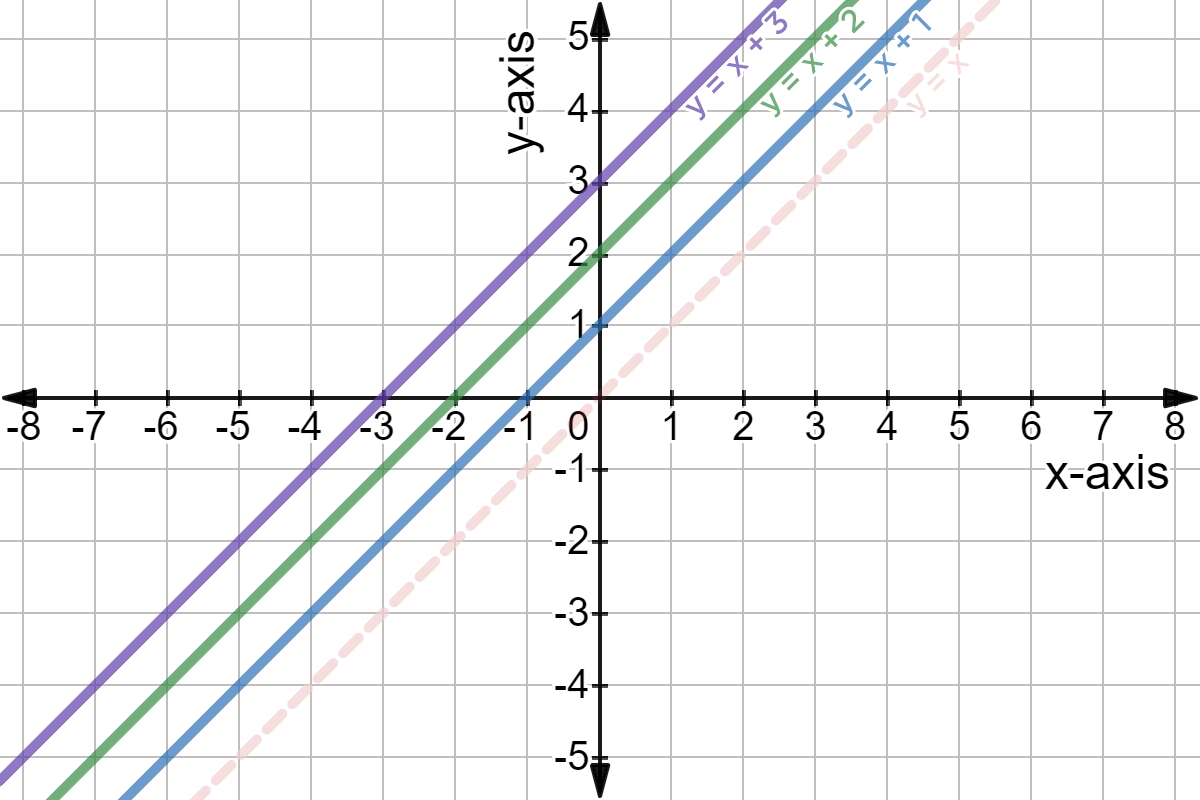
Linear functions are straight lines because the function increases or decreases the same amount for every unit of change.
You'll see this a lot in science experiments, where there's a constant relationship between an independent variable and dependent variable.
Graphing Linear Functions
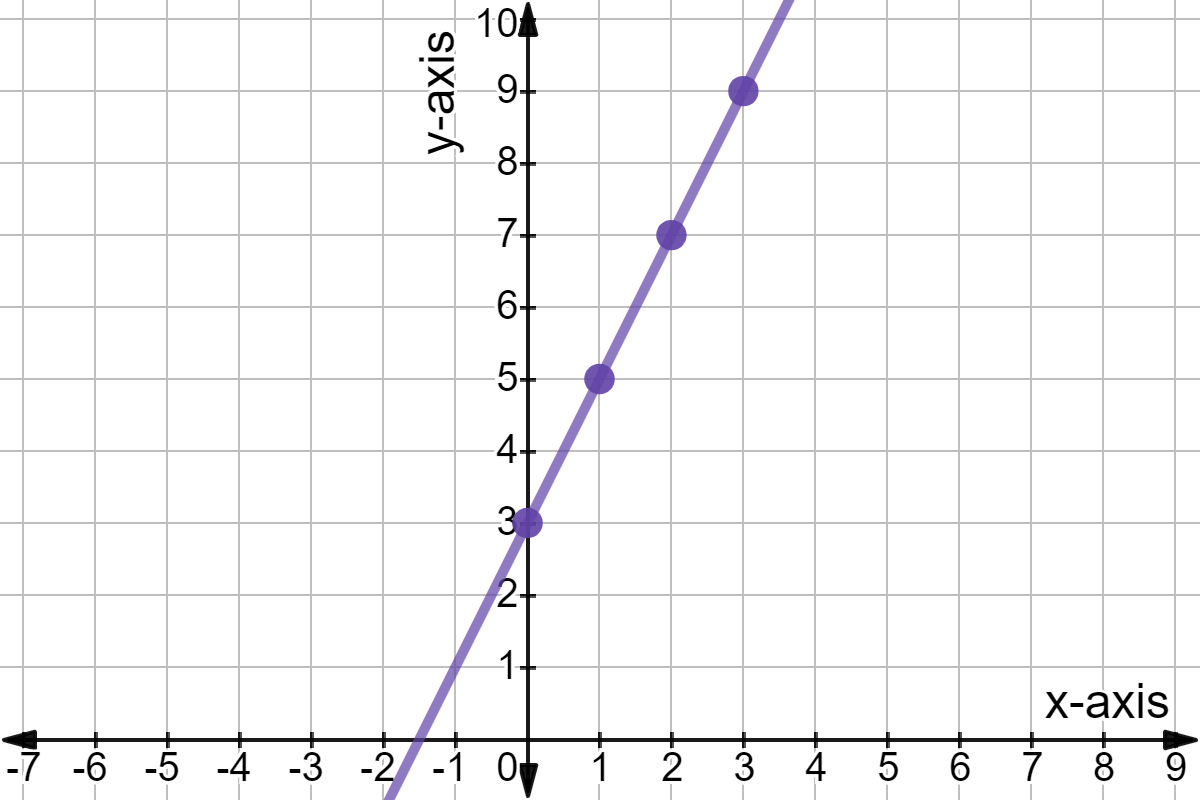
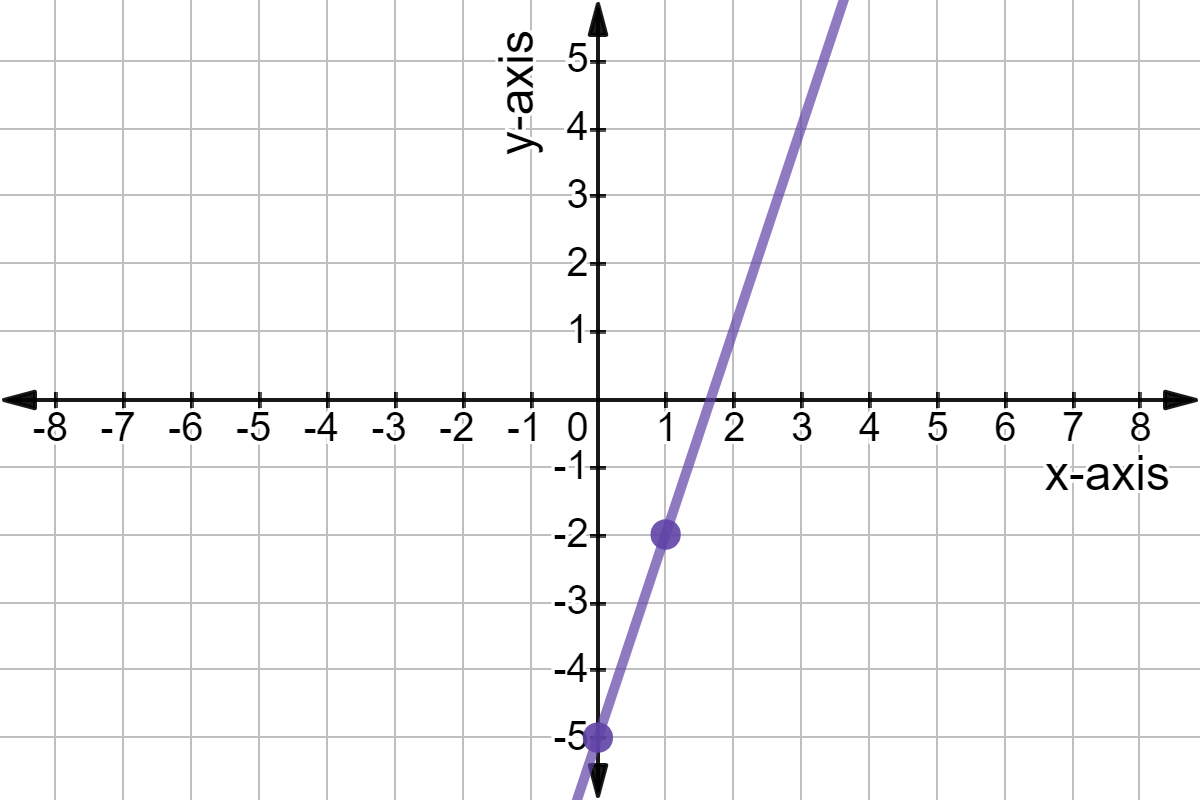
To graph linear functions, we need to plot at least points and connect them. We can choose any two points on the line so the goal is to pick easy to find ones.
Let's see how with an example. Suppose we want to graph: One of the easiest points to find is when ; we can simply throw out the term. We now have the point .

Made using Desmos
Choosing for the second point is another easy calculation. This gives us our second point of .

Made using Desmos
This is all we need to graph the function. Just draw the line that passes through these two points.
Made using Desmos