Menyelesaikan dengan menggunakan grafik

Illustrated · 1 min

Solving Systems of Linear Equations by Graphing

There are three solving methods for linear systems: substitution, elimination, and graphing. The graphing method lets you visualize systems of equations and their solutions.

This lesson will cover graphing a system of linear equations.

Let's start with the following system: 7y+10x=−114y−3x=−15\begin{align} 7y+10x&=-11 \\ 4y-3x&=-15 \end{align}

First, we have to put the equations into slope intercept form: y=mx+b.y=mx+b. y=−107x−117y=34x−154\begin{gather}y=-\frac{10}{7}x-\frac{11}{7}\\ y=\frac{3}{4}x-\frac{15}{4}\end{gather}

Now, we graph the equations.

A system of linear equations graphed.
The blue line is 7y + 10x = -11
The green line is 4y - 3x = -15

Created using Desmos

The point of intersection of these two lines is the solution to our system. Here, the lines intersect (the lines cross) at the ordered pair, (1,−3).(1,-3). So for the system of equations 7y+10x=−114y−3x=−15\begin{align} 7y+10x&=-11 \\ 4y-3x&=-15 \end{align} we can use graphing to determine that x=1x=1 and y=−3.y=-3. That is only one point.

We should always check our answers. Let's plug in x=1x=1 and y=−3y=-3 into each equation to make sure the statement holds true and represents a solution for both equations.

7y+10x=−117(−3)+10(1)=−11−21+10=−1111=−114y−3x=−154(−3)−3(1)=−15−12−3=−15−15=−15\begin{align}7y+10x&=-11\\ 7(-3)+10(1)&=-11\\ -21+10&=-11\\ 11&=-11\\ \\ 4y-3x&=-15\\ 4(-3)-3(1)&=-15\\ -12-3&=-15\\ -15&=-15 \end{align}

These variables are true for both equations, so they are the correct solutions to this system.

All other points on this coordinate plan represent points to solutions that are not true. It is also important to note that if the lines are parallel, the equations do not intersect, so there is no solution.

Here is a nifty little image to help you do this process in the future:

System of Equations: Graphing
Step 1: Slope-intercept form
Step 2: Graph the equations
Step 3: Find the point of intersection

Image source: by Anusha Rahman

Interactive · 1 question

There are three direct approaches to solving systems of equations:

  1. Substitution
  2. Elimination
  3. Graphing (here!)

The great news is that all three methods should help you arrive at the same answer. Graphing can be an effective way of solving the problem or checking your work. It can even be used when solving other kinds of systems of equations (like linear-quadratic systems)! If you're unsure of the answer you got from graphing, you can double check with any other method, and vice versa.

Let's consider this system of equations:

6x+3y=−30x+y=−4\begin{align} 6x + 3y = -30 \\ x + y = -4 \end{align}

In order to graph, we need to convert both equations into slope-intercept form.

Slope-intercept form looks like y=mx+b.y = mx + b.

Recall that mm (the coefficient for our xx term) will be our slope and that bb is the yy-intercept (where the line crosses the yy-axis).

We can rework our initial equations so that they are in slope-intercept form.

6x+3y=−30⇒y=−2x−10\begin{align} 6x + 3y &= -30 \\ \Rightarrow y &= -2x - 10\\ \end{align} x+y=−4⇒y=−x−4\begin{align} x + y &= -4\\ \Rightarrow y &= -x - 4 \end{align}

So, the line for our first equation has a slope of −2-2 and a yy-intercept of −10-10, and the line for our second equation has a slope of −1-1 and a yy-intercept of −4-4.

Get yourself a piece of graph paper or your graphing calculator and let's start graphing.

 A system of linear equations where the blue line is $y = -2x - 10$ and the red line is $y = -x - 4$.

Created using Desmos

We're almost there!

The values of xx and yy are the point where the lines intersect. Think about it: the one thing our two original equations have in common is these values of xx and yy. This is the one point they share on the graph.

What is the point of intersection of our two lines?

Choose one answer

Video · + 1 min read

(Video) Solving Systems of Equations By Graphing

by Friendly Math 101

Here's a video by Friendly Math 101 showing you how to solve a system of equations by graphing.

Summary\large{\text{Summary}}

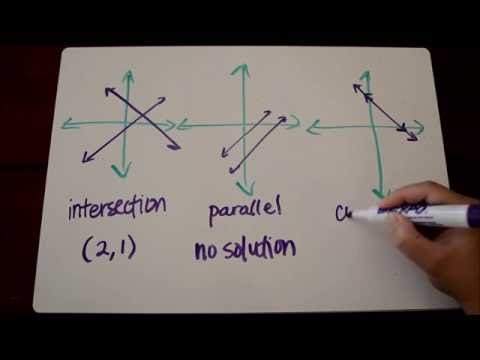
There are three possible outcomes when solving by graphing.

  1. We have intersecting lines. This means we have one solution for the system and it's the point where the lines intersect.
  2. We have parallel lines. Parallel lines will never intersect so they will never share a common point. This means there is no solution to the system.
  3. If you have the same line (coinciding lines) then every point is being shared. Therefore there's an infinite number of solutions.

Let's look at the following system of linear equations: y=12x+2y=−x+5\begin{align} y&=\frac12x+2\\ y&=-x+5 \end{align}

To begin, we graph both these lines and see where the common point is, if any.

The lines intersect at the purple point: (2,3).

Graphs of y = 0.5x + 2 and y = -x + 5.

Created using Desmos

Graphing both these lines we see they intersect at the point (2,3)(2,3). Therefore our solution to the system is (2,3),(2,3), or x=2,y=3.x=2, y=3. Let's check that both of the equations are valid when we plug in x=2x=2 and y=3.y=3.

y=12x+23=12(2)+23=1+23=3\begin{align} y&=\frac{1}{2}x+2\\ 3&=\frac{1}{2}(2)+2\\ 3&=1+2\\ 3&=3 \end{align} y=−x+53=−2+53=3\begin{align} y&=-x+5\\ 3&=-2+5\\ 3&=3 \end{align}

Both of these equations are valid, so x=2x=2 and y=3y=3 os our solution!

Try it yourself!

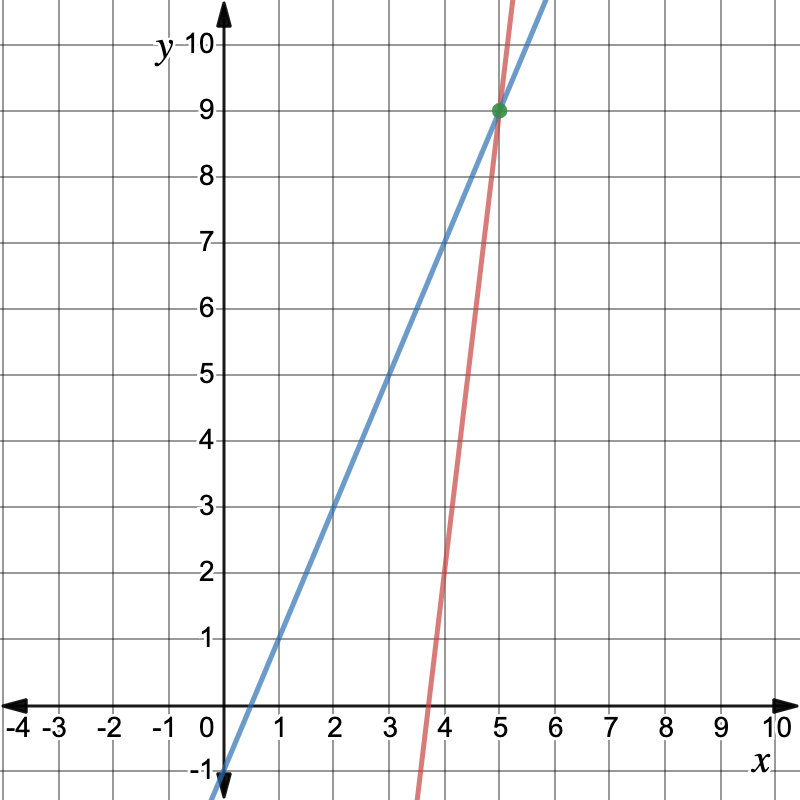
Find the the solution to the linear system y=7x−26y=2x−1\begin{align} y&=7x-26\\ y&=2x-1 \end{align}

Choose one answer

Type a concept, like “slope” or “photosynthesis”.

↑ ↓ to choose · Enter to openSearch explanations and problems