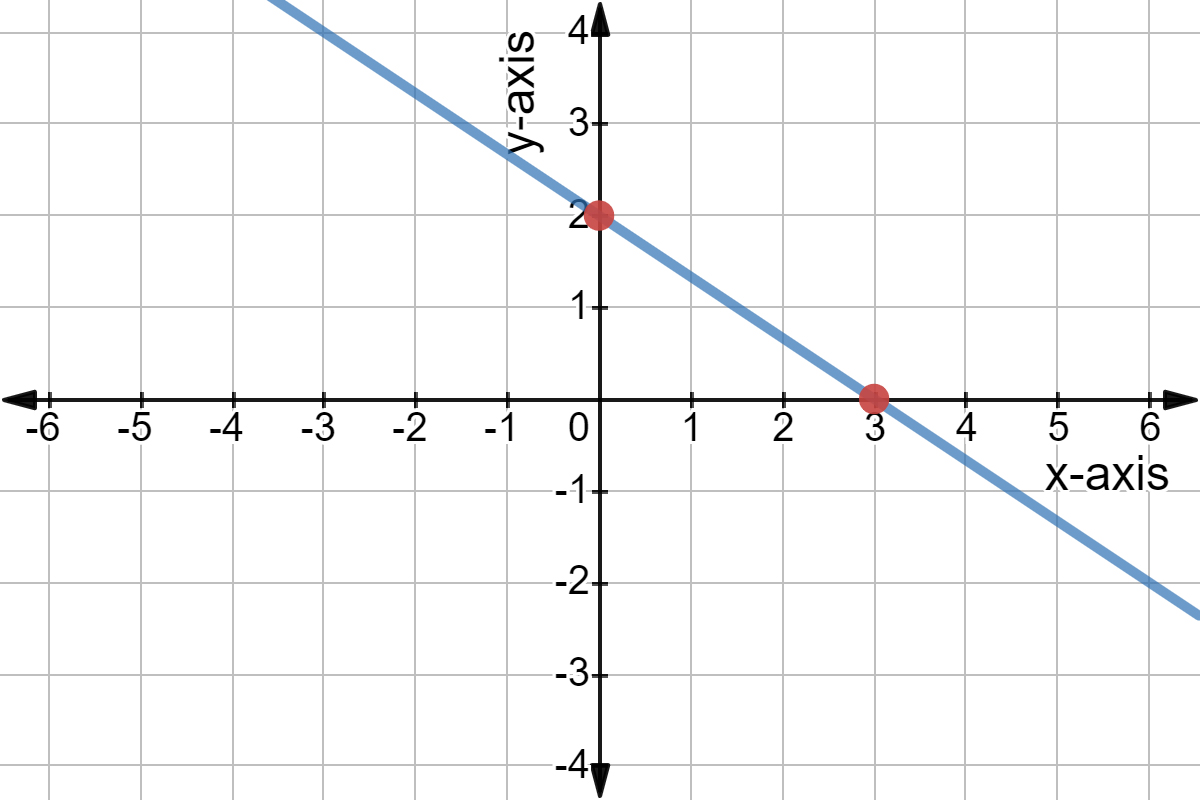
This video by Patrick JMT explains how to draw a graph of an equation in standard form using the x- and y-intercepts.
Summary
Intercepts
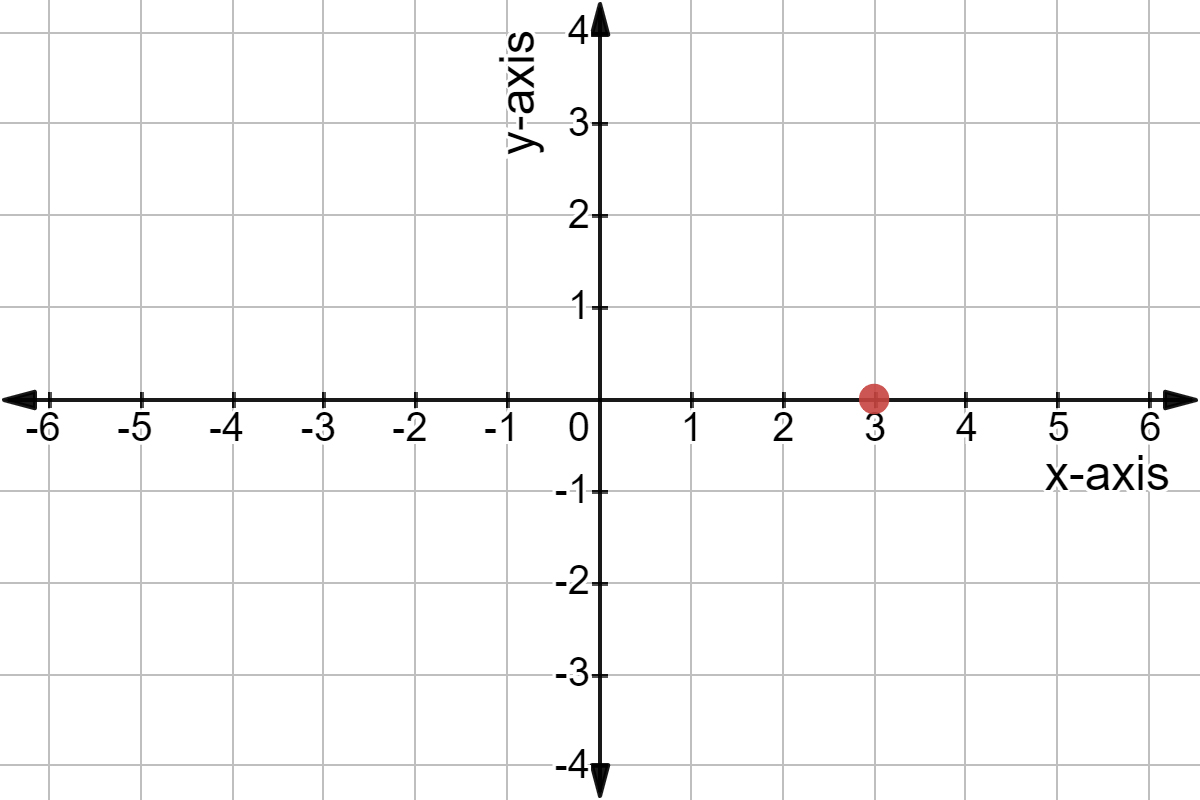
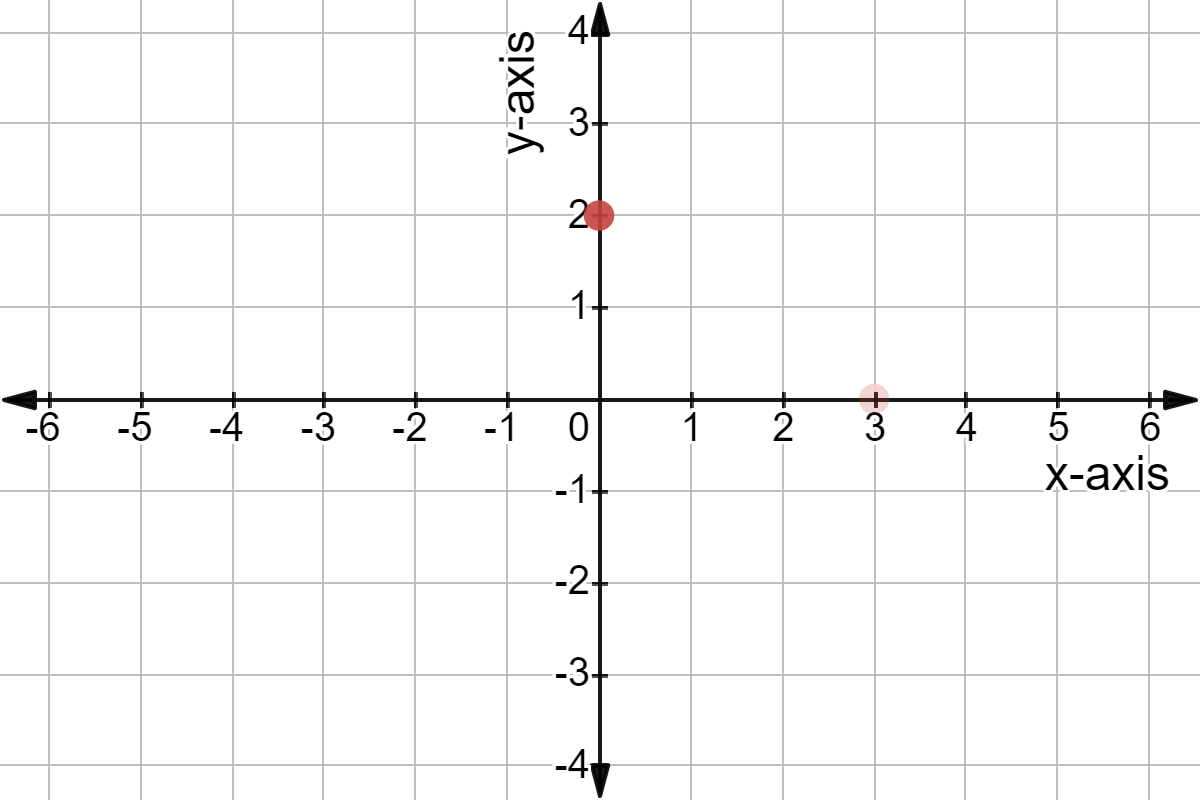
An intercept is the point where the graph crosses an axis. So the x-intercept is the point where the graph crosses the x-axis and the y-intercept is the point where the graph crosses the y-axis.
If we look at a graph, we see that any x-intercept will have a y coordinate of 0. Similarly, any y-intercept will have an x coordinate of 0.
Using the standard form of an equation we can easily find the intercepts.
- To find the x-intercept, we set y=0 and solve for x.
- To find the y-intercept, we set x=0 and solve for y.
Then, because two points define a line, we can graph our equation by drawing a line through these intercepts!
Example
Plot the intercepts of 2x+4y=12 and use them to graph the equation.
Starting with finding the x-intercept, we set y=0 and solve for x.
2x+4y2x+4(0)2x22xx=12=12=12=212=6
Our x-intercept is (6,0).
For the y-intercept, we set x=0 and solve for y.
2x+4y2(0)+4y4y44yy=12=12=12=412=3
Our y-intercept is (0,3).
Finally, we can plot these points, and draw the line that goes through them. This will be the graph of our equation!
Solution
To find the x-intercept, we let y=0 and solve for x.
10x+5y10x+5(0)10xx=105=105=105=521
So the x-intercept is at the point (221,0).
To find the y-intercept, we let x=0 and solve for y.
10x+5y10(0)+5y5yy=105=105=105=21
So the y-intercept is at the point (0,21).