The Chi-Square Test
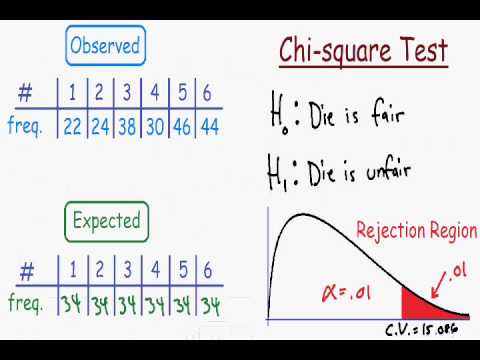
The Chi-Square Test is a statistical test that is used to determine any differences between sets of data. We usually use the chi-square test to assess the “goodness of fit” between our observed values and the values we would theoretically expect.
The Goodness-of-Fit Test
As said before, the chi-squared test can be used in a goodness-of-fit test to test if a set of data follows a certain distribution. This measures the “goodness-of-fit” of the data to the distribution.
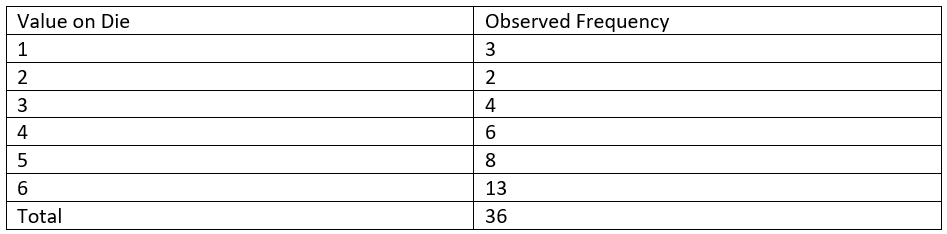
Let’s say that you are playing a dice game with your friends. In order to win a round, you must have the highest number in the group. However, your friend Ben decides that he is going to use his “lucky” die, rather than the die given to him. Suspicious of this “lucky” die, you decide that you’re going to record the number Ben gets on his roll. You collected the following data.
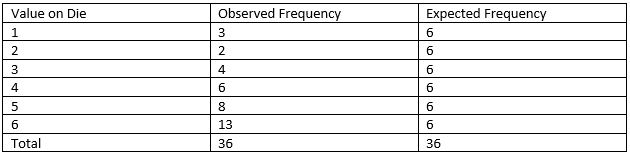
With your prior math knowledge, you know that each value on the die has a 61 chance of happening. From the looks of these rolls, you think his “lucky” die might be loaded.
However, since you do not want to risk the friendship between you and Ben, you decide you want to test if the die is loaded, or if it was just chance that he rolled higher numbers most of the time. You set up a new table to begin your journey.
Now, we want to hypothesize what is going to come from performing the chi-square test. You decide to give Ben the benefit of the doubt, and hypothesize that the dice are fair dice. You can write out the hypotheses as:
Ho (Null hypothesis): The dice are fair
Ha (Alternative hypothesis): The dice are NOT fair
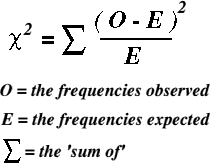
In order to test the goodness-of-fit of the collected data to the expected data, we can use the chi-square statistic to get a chi-square value.
χ2=ΣExpected Frequency(Observed Frequency – Expected Frequency)2
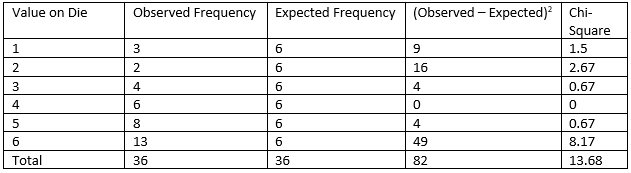
What this says is that we can get a chi-squared value by summing up the values of the observed frequencies minus the expected frequencies squared, divided by the expected frequency. We can create another table that looks like:
What we gather from this is that our χ2 value is 13.68. Now, we need to find our degrees of freedom, which is equal to the number of terms used in calculating the chi-square value. This was the total number of values on the die, so our degrees of freedom for this problem is 6.
Now, we must go to a standard table of chi-square values to look for the standard chi-square value for 6 degrees of freedom. From the table, we see that for a chi-square test with 6 degrees of freedom, our value is 12.5916.
This critical value is less than our calculated chi-square value, meaning we reject our null hypothesis, Ho, which means that the “lucky” die does NOT follow a standard die’s expected output. Needless to say, you are not inviting Ben over for game night anymore, since the “lucky” die is actually weighted!
Summary
In order to perform a goodness-of-fit chi-square test, you must do the following:
1) Collect data
2) Establish hypotheses
3) Calculate chi-square statistic using the number of observations, expected values, and observed values
4) Use the degrees of freedom to find the tabular chi-square value
5) Decide on whether or not to accept the null hypothesis. If the calculated chi-square is larger than the tabular, we reject the null hypothesis. If the calculated chi-square is smaller than the tabular, we accept the null hypothesis.