Read · 2 min
+1 contributors

The magical two-way table
The reason why conditional probability is hard at first is that one is confused by all the different scenarios and probabilities. A two-way table, however, can make an otherwise complicated problem quite simple.
An Example
To demonstrate, let's start with a problem that perennially perplexes doctors.
A horrible disease is spreading around that affects 1 in 100,000 people. Scientists have created a test that will predict whether you have the disease with 99% accuracy. If you have it, there is a 99% chance it returns positive and 1% chance it returns negative, and vice versa if you don't have it. You take the test, and suddenly, the test returns positive! Do you panic?
Guess the chance that you actually have the disease.
About one in one thousand. Little reason to worry about.
But wait! The test had 99% accuracy! Maybe it could work better...
That is our intuition misleading us, as with all conditional probability problems. However, we can clarify that by using a two-way table.
The columns will separate the people who have or don't have the disease in actuality, and the rows will separate the people by test result.
Now to fill our table. Let's say we have 10 million people who take the test. Since 1 in 100,000 people have the disease, there will be about 100 people in the sample with the disease. 99 will have tests returning positive, and 1 unfortunate victim will have a test saying negative.
Now let's think about the remaining 9,999,900 people. 99% of those will have a negative result (9,899,901 people), and 1% (99,999 people) will get a false positive.
So now we can answer: given that you have a positive result, what is the chance you have the disease?
We can safely throw away the negative row, since the result was positive. So are you more likely to be part of: the 99 true positives, or the 99,999 false positives?
Well, the chance you have the disease is the number of true positives over the total, or , which is about one in 1000.
Think about this: why do tests become worse when the likelihood of something becomes rarer?
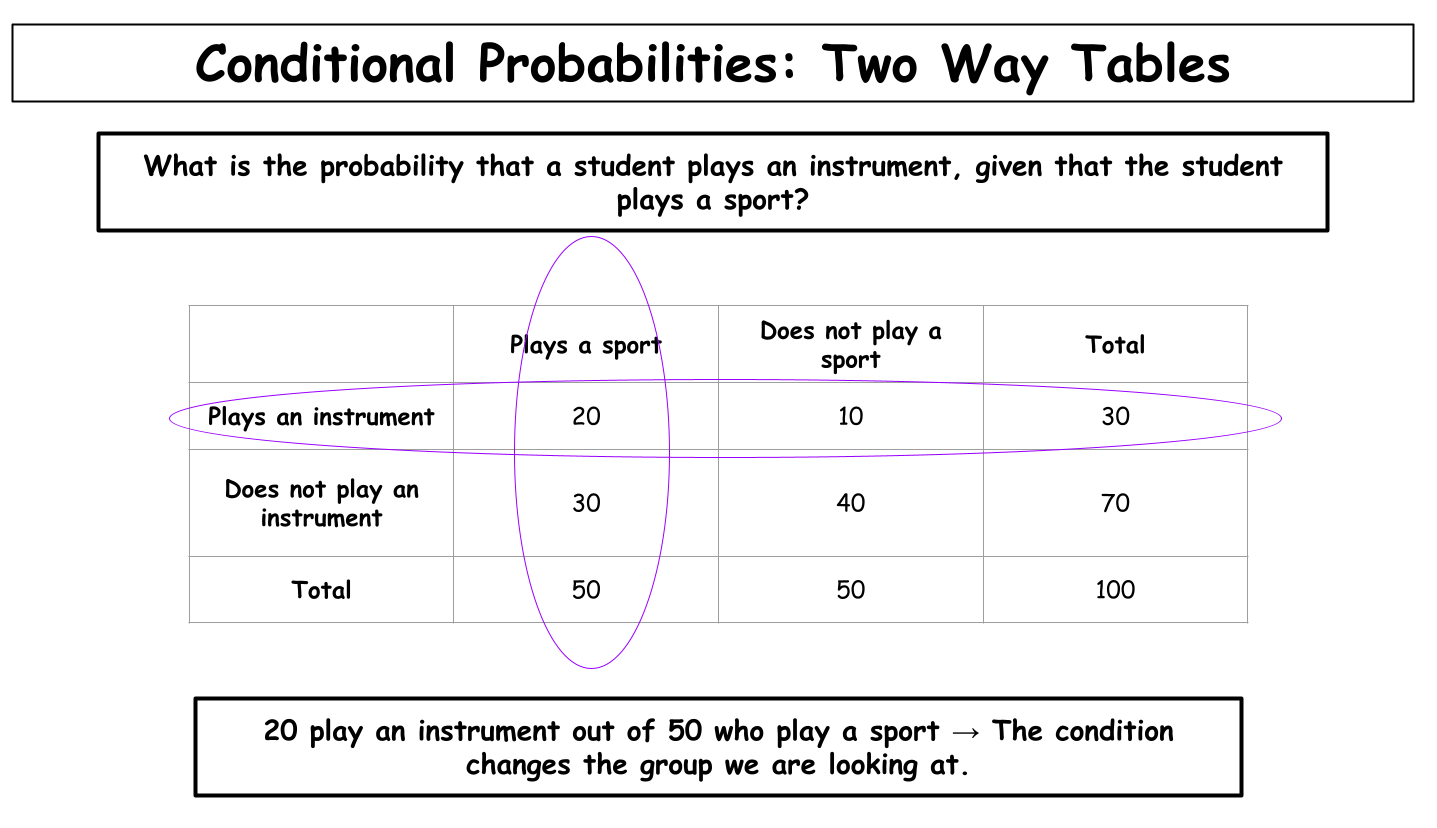
We can also use the two-way table when looking at probability of something being randomly selected.