Sistema de coordenadas cartesianas

Before this, knowO que seriam um numero real?

Video · + 1 min read

(Video) Introduction to Graphing

by mathman1024

Here's a video by mathman1024 explaining the basics of graphing.

Summary\large{\text{Summary}}

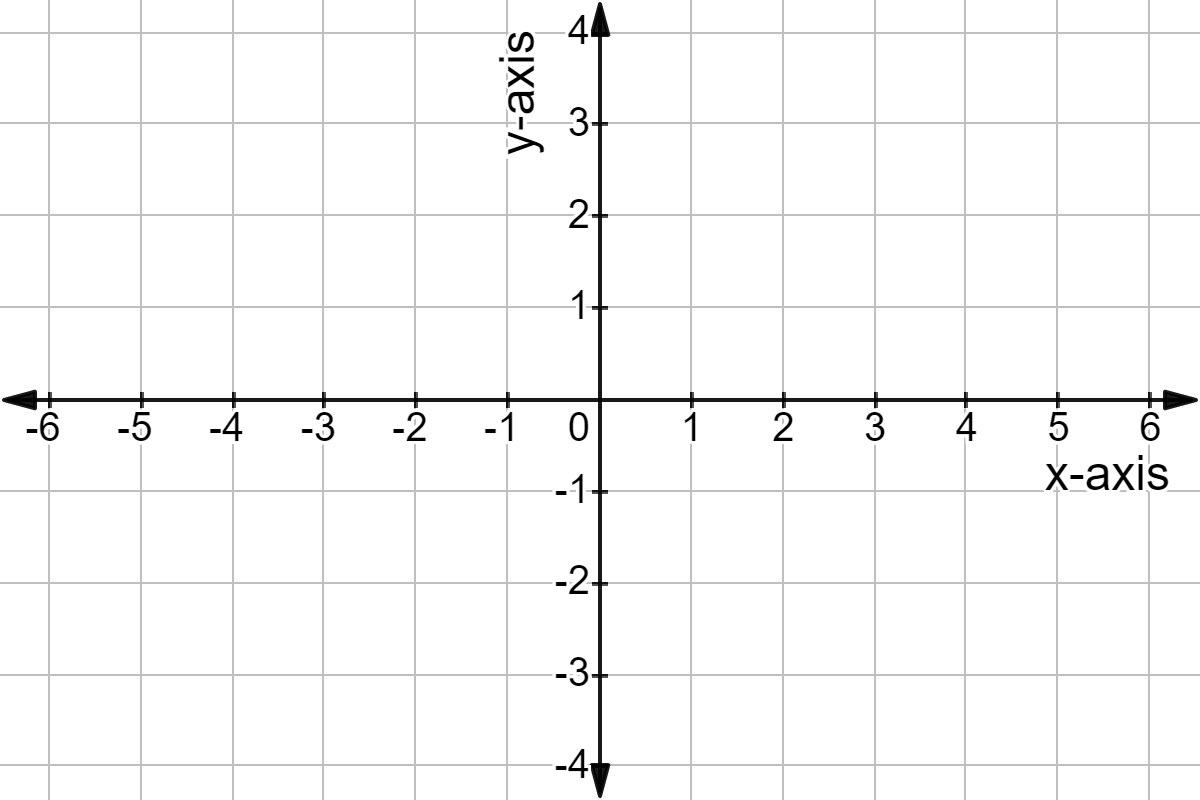
Graphing is done on the rectangular coordinate system which is made up of two axes. The horizontal axis is called the xx-axis and the vertical axis is called the yy-axis. The xx-axis is a horizontal line. The yy-axis is a vertical line. That means we are pairing up two real numbers. We can move left-right or up-down.

A cartesian coordinate plane.

Made using Desmos

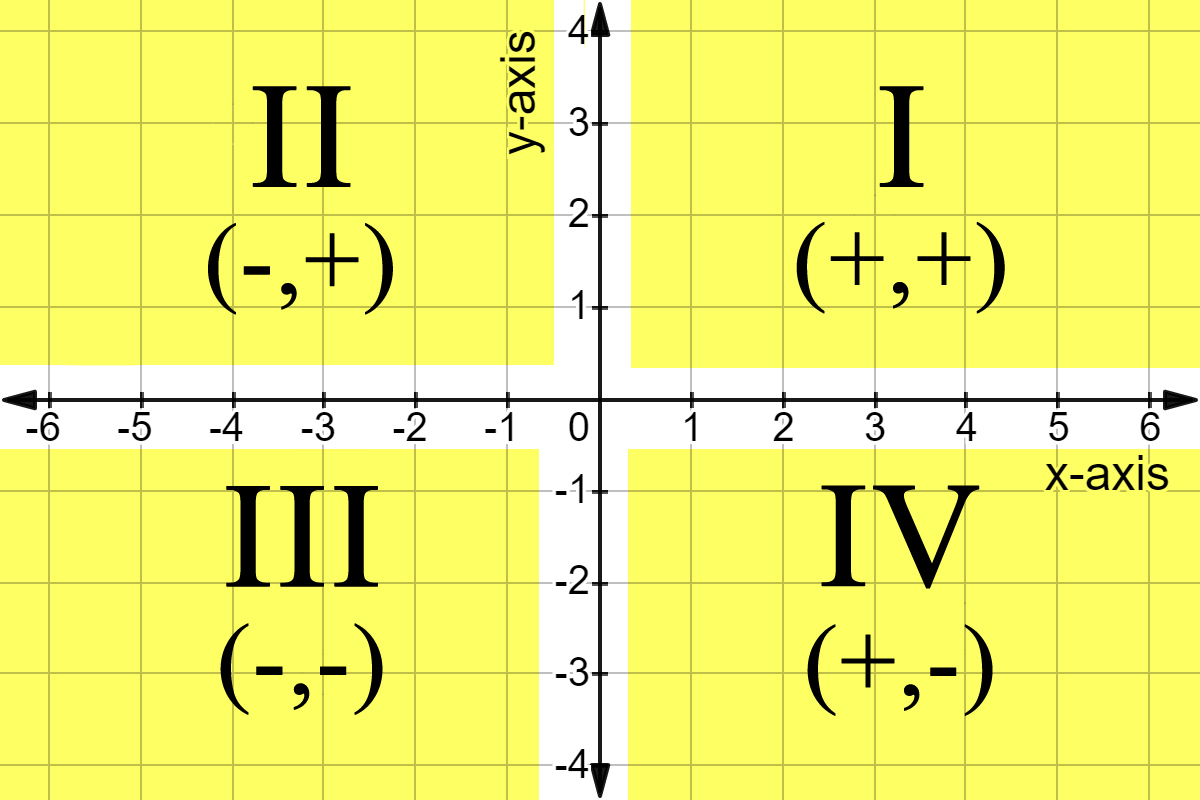
The coordinate plane is broken down into quadrants that go in a counterclockwise pattern.

The four quadrants of the coordinate plane.

Made using Desmos

The point of intersection of the two axes is called the origin. It has an xx value of 00 and a yy value of 00.

The origin or (0,0) is at the center of the coordinate plane.

Made using Desmos

Points on the graph are given as ordered pairs which are of the form (x,y)(x,y). The xx-coordinate tells you where on the xx-axis the point is and the yy-coordinate tells you where on the yy-axis the point is. Each tells you half of the information needed in order to plot the point. (2,3)≠(3,2)(2,3)\neq(3,2) If we graph these two points we see they're not the same. To graph a point, start from the origin. Then move to the left or right by the amount in the first part. Then move up and down by the amount indicated from the second part.

The points (3,2) and (2,3).

Here's the difference between the two points.

Made using Desmos

While we're just plotting points for now, we can also graph functions. These coordinate systems are also useful in statistics. If we plot a bunch of points we get something called a scatter plot.

Video · + 4 min read

(Video) Graphing on the Coordinate Plane

by Math Antics

Here's a video by mathantics that explains graphing.

Summary\large{\text{Summary}}

Graphing is essentially taking mathematical relationships and turning them into pictures. Graphing is a way to make a visual representation of an equation or data set so you can understand it better.

The first major term for graphing is the coordinate plane.

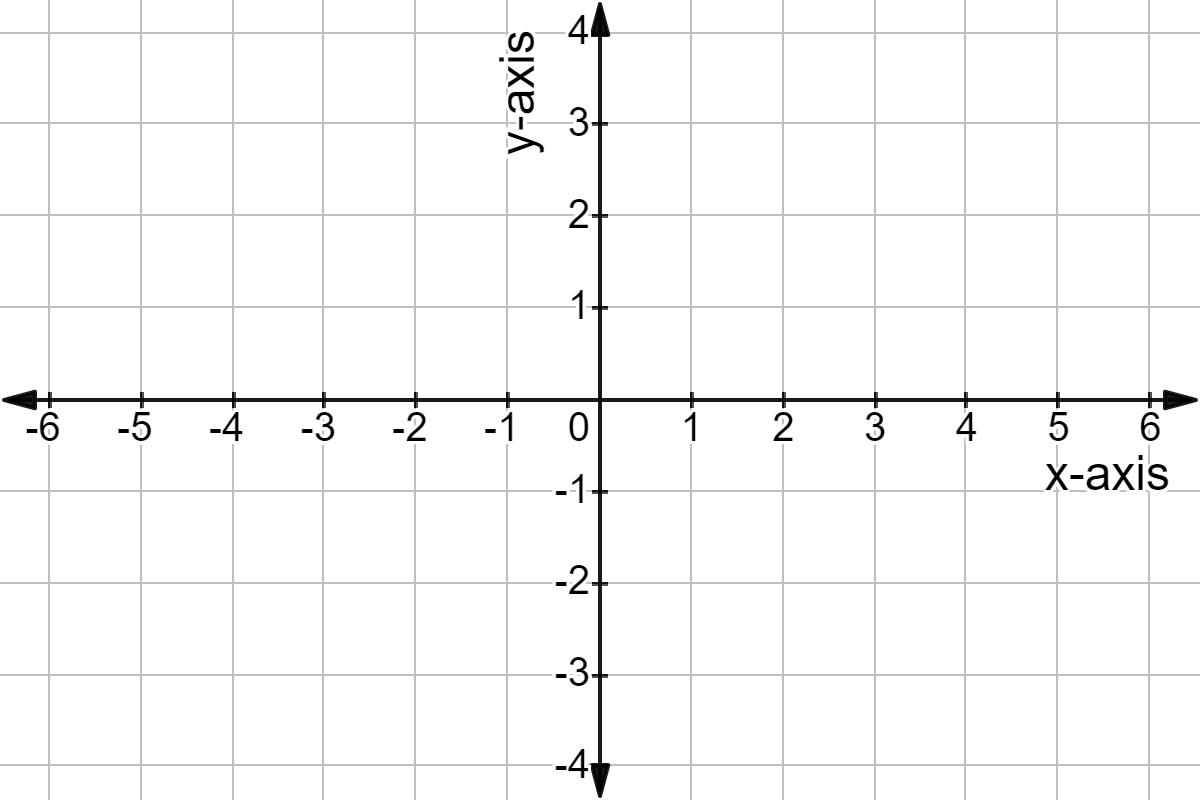
A coordinate plane with an x-axis and y-axis.

A coordinate plane.

Made using Desmos

The coordinate plane is the platform on which our graphing will take place. A coordinate place is similar to a number line...

A number line.

A number line.

Made using Desmos

...but it's got two dimensions, the xx-axis and the yy-axis!

You might remember that a number line starts at 00 and increases (moves towards positive numbers) as you move to the right and decreases (moves towards negative numbers) as you move to the left; usually with marks showing you where each integer is along the way.

If you take the number line, copy it, and rotate it 90∘90^{\circ}, you get the coordinate plane. It's now a two dimensional representation of the number line.

With the number line, plotting points was easy. You only needed to know one number and you can place a point. With the coordinate plane, since it's two dimensional, you need two numbers in order to plot each point. These two numbers are called coordinates of a point. Coordinates use a special format to help you recognize them: (#,#)(\#,\#) The two numbers are put in-between parentheses, separated by a comma.

To understand how coordinates work we have to remember that our coordinate plane is made up of two perpendicular number lines. Each of these number lines are called an axis. One of the axes is horizontal, like the horizon.

The number line highlighted on the coordinate plane makes the horizontal axis or x-axis.

The horizontal axis or xx-axis.

Made using Desmos

The other axis is vertical.

The vertical number line highlighted on the coordinate plane makes the vertical axis or y-axis.

The vertical axis or yy-axis.

Made using Desmos

Because of this, they're often called the horizontal axis and vertical axis. But even more often, they are referred to by variable names. The horizontal axis is called the xx-axis and the vertical axis is called the yy-axis. The reason we use variable names is because it's more flexible and because each of the coordinate numbers is a variable, (x,y)(x,y), that relates to a specific position along one of the two axes of the coordinate plane.

The first coordinate listed, (x,y)({\color{#29A603}{x}},y) will be called xx and the second coordinate listed, (x,y)(x,{\color{#8925AE}{y}}), will be called yy. The numbers will always be listed in that same order. xx first and yy second. Coordinates are often called ordered pairs because they're a pair of numbers always listed in the same order. So if you have the coordinates (3,5)(3,5) this means that x=3x=3 and y=5y=5.

Now we can begin plotting our coordinates. The first number in the coordinate tells us where on the xx-axis the point is located and the second number tells us where the yy-axis is located. The two numbers work together to give us one point. Each number only gives us half the information on where the point is.

Let's try it out by plotting the point (3,2)(3,2). First, we locate the xx-value, 33, on the xx-axis. Instead of putting a point there, we either draw or imagine a dashed line perpendicular to the xx-axis that goes through the 33.

A dashed vertical line at 3 on the x-axis.

Made using Desmos

We do this because the first number only tells us where along the xx-axis the point is but it can be anywhere along the yy-axis. We won't know until we look at the second number. So we draw the line temporarily to represent every possible point that can have an xx-value of 33.

Now we locate the yy value, 22, along the yy-axis. Again, we don't put a point but instead draw a perpendicular dashed line through it.

A dashed horizontal line at 2 on the y-axis.

Made using Desmos

We do this because the second number only tells us where along the yy-axis the point is but it can be anywhere along the xx-axis. So we draw the line temporarily to represent every possible point that can have an yy-value of 22.

But look! The exact point where the two lines intersect represents the only point on the entire plane where both x=3x=3 and y=2y=2. That intersection is the location of our point!

THe point where the two dashed lines intersect: (3,2).

Made using Desmos

Hmm that seemed to take a while though. How about a simpler, and more intuitive, way to plot these points? Luckily there is one. We start by putting our point on the origin, or (0,0)(0,0) and use the coordinate as a set of instructions on where to move the point.

The origin is the center: (0,0).

Made using Desmos

So to plot the point (3,2)(3,2) we look at the first number to see how far we move our dot in the xx direction. Since xx is positive 33 we move our point three units in the positive xx direction.

From the center, move out to 3 on the x-axis.

Made using Desmos

Then, since our yy is positive 22, we move the point two units in the positive yy direction.

Then move up to 2 along the y-axis.

Made using Desmos

Try plotting these point's by yourself. Click continue to see the answers.

  1. (−4,3)(-4,3)
  2. (−3,−3)(-3,-3)
  3. (4,−2.5)(4,-2.5)
A coordinate plane with the points (3,2), (-4,3), (-3,-3), and (4,-2.5).

Made using Desmos

Quadrants

Have you noticed that each of these points is plotted in a different region of the coordinate plane?

Each of these points are in a different section of the graph.

Made using Desmos

These four regions are called quadrants and their boundaries are defined by the two axes of the coordinate plane. The quadrants are named 1 through 4 so they can be easily referred to.

The top right section is the First Quadrant. The top left is the Second Quadrant. The bottom left is the Third Quadrant. The bottom right is the Fourth Quadrant.

Made using Desmos

  1. Quadrant 1 is the upper right corner and contains all the points where both xx and yy are positive. (x,y)=(+,+)(x,y)=(+,+)
  2. Quadrant 2 is the upper left and contains all the points where xx is negative and yy is positive. (x,y)=(−,+)(x,y)=(-,+)
  3. Quadrant 3 is the bottom left and contains all the points where both xx and yy are negative. (x,y)=(−,−)(x,y)=(-,-)
  4. Quadrant 4 is the bottom right and contains all the points where xx is positive and yy is negative. (x,y)=(+,−)(x,y)=(+,-)

Usually we use roman numerals to label the four quadrants.

Q1's coordinates will be in the form (+,+).
Q2's coordinates will be in the form (-,+).
Q3's coordinates will be in the form (-,-).
Q4's coordinates will be in the form (+,-).

Made using Desmos

Interactive · 2 questions

The Cartesian coordinate system is a system that is used to create visual representations of equations. These representations are made on a grid called the Cartesian Plane.

The Cartesian Plane can be thought of as a map. A map allows us to find the location of something or someone by using street names and numbers. Just like a map, The Cartesian Plane allows us to find the location of a point.

Let's begin with the map below. We can describe where the man, Charlie, is standing by using street names. i.e. Charlie is on 3rd Avenue and College Street.

A map of a town.

The Cartesian Plane is a grid made up of two number lines that run perpendicular to each other. The two lines intersect at 00 which is the middle or the origin of the grid. Below is a Cartesian Plane.

A coordinate plane.

Made using Desmos

The two number lines that make up the grid are called axes.

The number line that runs up and down is the vertical axis or the yy-axis. The number line that runs left to right is the horizontal axis or the xx-axis.

Similar to the map, the location of something can be found using this grid. In the map, Charlie's location was described using the intersection of the roads he was on, the location on a coordinate plane works the same way. In the map below, let the black dot represent Charlie.

A coordinate plane with Charlie at (3,2).

Made using Desmos

In order to describe his location, we will use ordered pairs.

Ordered pairs are used to describe the location of a point by using two numbers in the following format; (#,#)(\#,\#).

The first number in this format is the number of units to the right or left of the yy-axis. This number is called the xx-value.

The second number is the number of units above or below the xx-axis. This number is called the yy-value.

Notice that Charlie is 33 units to the right of the yy-axis and two units above the xx-axis so Charlie is located at the point (3,2)(3,2).

The plane below represents where Charlie has moved to.

A coordinate plane with Charlie at (4,-2).

Made using Desmos

Which ordered pair describes the location of Charlie now?

Choose one answer

Type a concept, like “slope” or “photosynthesis”.

↑ ↓ to choose · Enter to openSearch explanations and problems