Gráficos

Before this, knowAsymptotes of Exponential Equations

Video

(Video) Exponential Graph

by HEGARTYMATHS

Here's a video by HEGARTYMATHS going over the graph of an exponential function.

Summary\large{\text{Summary}}

The graph of an exponential function never goes to zero but gets very very close. On the other side the numbers begin to grow incredibly fast. This is called "growing exponentially".

Test Yourself: Are y=4−xy=4^{-x} and y=14xy=\frac14^x the same graph?

Choose one answer

Illustrated · 1 min

Exponential Function Graph

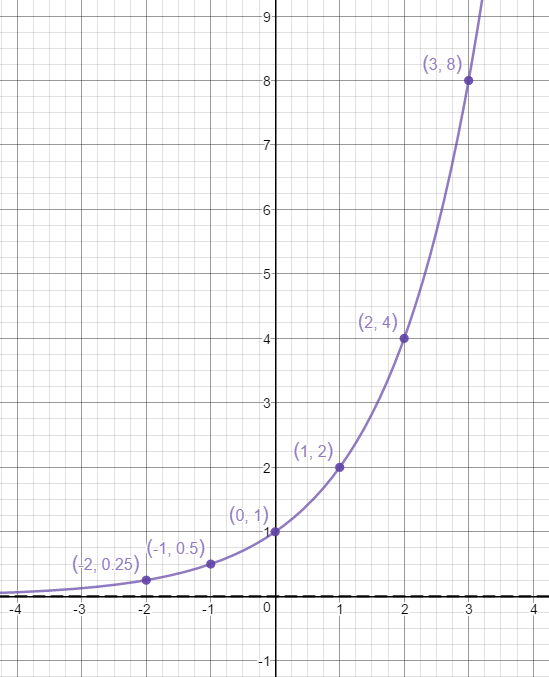
Let's graph f(x)=2xf(x)=2^x So let's first make a t-table of values. xy−22−2=122=14−12−1=12020=1122438\begin{array}{c|l} x&y\\ \hline -2&2^{-2}=\frac1{2^2}=\frac14\\ -1&2^{-1}=\frac12\\ 0&2^0=1\\ 1&2\\ 2&4\\ 3&8 \end{array} Let's plot these points now:

The following points are graphed on a coordinate grid: (-2, 0.25), (-1, 0.5), (0, 1), (1, 2), (2, 4), (3, 8).

Made using Desmos

Now we connect them to give is our graph. Notice that the graph keeps approaching 00 but never reaches it. This means we have a horizontal asymptote at y=0y=0.

A line is drawn through the aforementioned points.

Made using Desmos

We can also see Domain: (−∞,∞)Range: (0,∞)\begin{align} \text{Domain: }&(-\infty,\infty)\\ \text{Range: }&(0,\infty) \end{align}

The graph of f(x)=2^x.

Made using Desmos

So we see with exponential functions, that they increase dramatically. As you see each xx step you take you actually double the yy value.

An example of exponential growth is population size over time. It is easy to think about population size in medieval times and compare it to now and picture this graph!

Video

(Video) Exponential Fraction Graphs

by mathman1024

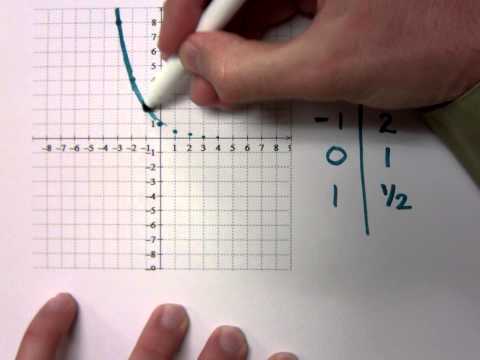
Here's a video by mathman1024 where he graphs an exponential function where the base is between zero and one.

Summary\large{\text{Summary}}

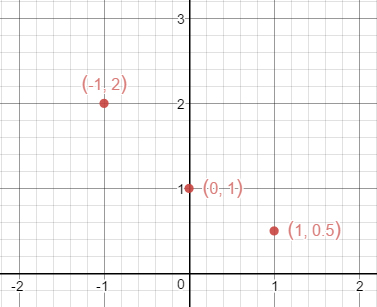
The function he looks at is: f(x)=(12)xf(x)=\bigg(\dfrac12\bigg)^x. In this problem our base is 12\frac12 which is between zero and one, so our graph will look at little different. He starts by making a t-table. xy−1201112\begin{array}{c|c} x&y\\ \hline -1&2\\ 0&1\\ 1&\frac12 \end{array} Let's plot these points and see what happens.

The following points are graphed on a coordinate grid: (-1, 2), (0, 1), (1, 0.5).

Made using Desmos

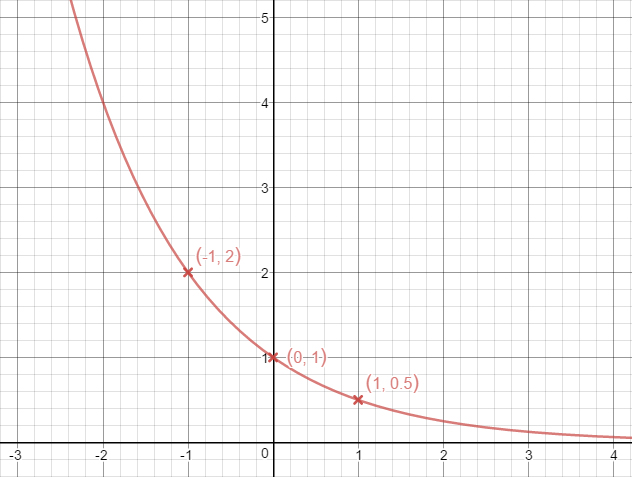
So it seems as we go to the left now, the points begin growing by ×2\times 2. In fact, this graph is the reflection of f(x)=2xf(x)=2^x over the yy-axis.

A line is drawn through the aforementioned points.

Made using Desmos

Just like with f(x)=2xf(x)=2^x there's still a horizontal asymptote at y=0y=0. Also the domain and range are still the same: Domain: (−∞,∞)Range: (0,∞)\begin{align} &\text{Domain: }(-\infty,\infty)\\ &\text{Range: }(0,\infty) \end{align}

Video

(Videos) More Complicated Exponential Function Graphs

by mathman1024

In this video by mathman1024 he graphs a more complicated exponential function by applying the different transformation.

Summary\large{\text{Summary}}

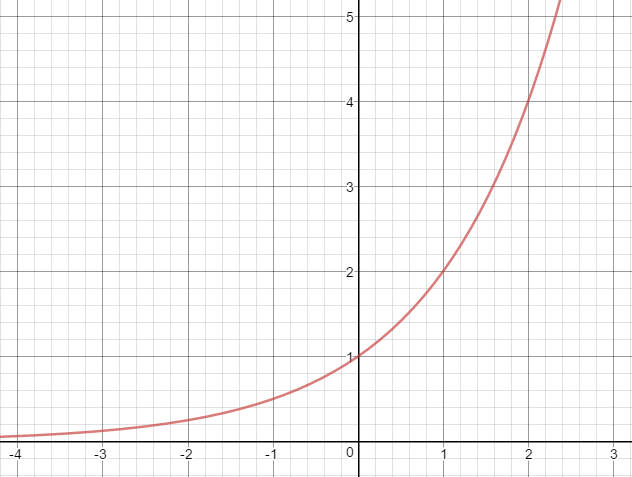
The function he graphs is: f(x)=2x−2−5f(x)=2^{x-2}-5. The first step is to figure out the base function. For this problem the base function is clearly 2x2^x.

graph of y=2^x

Made using Desmos

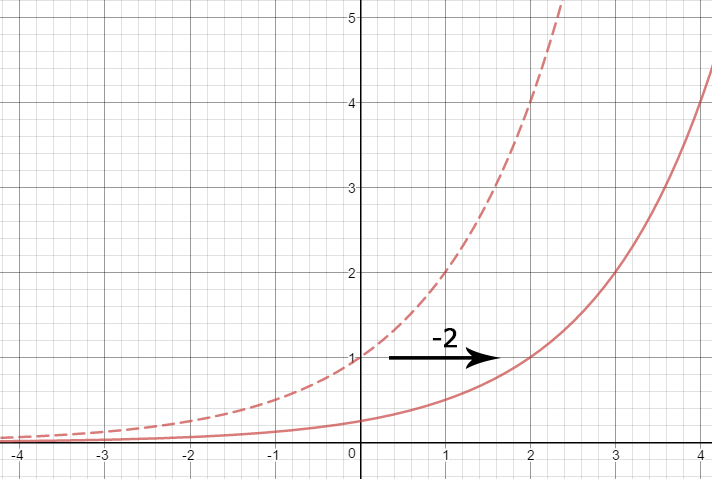
Next we notice there's a −2-2 inside the base function: f(x)=2x−2−5f(x)=2^{x\color{#8925AE}{-2}}-5. This is the horizontal transformation. If it's positive it means we move the graph to the left and if it's negative we move the graph to the right. Since this is negative, we move our graph two units to the right.

graph of 2^(x-2)

Made using Desmos

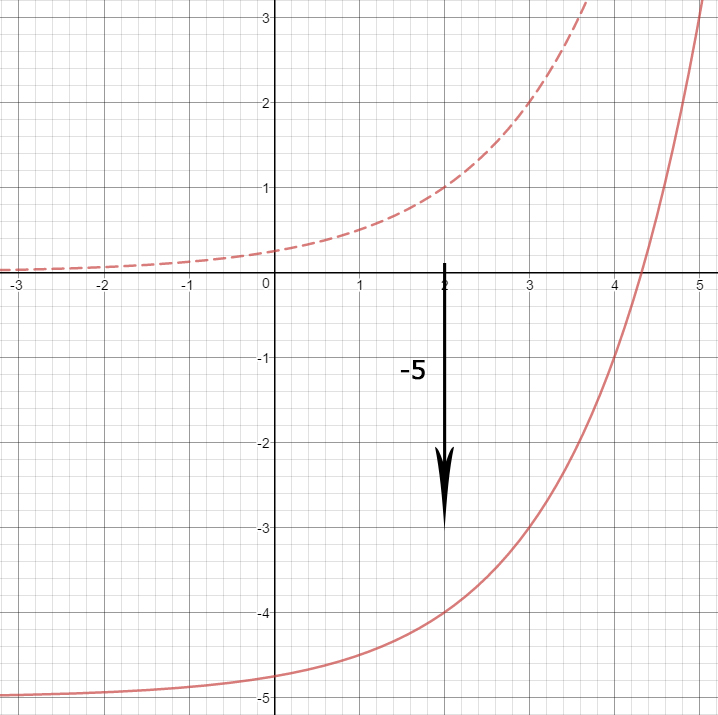
The final transformation is the −5-5 outside the function: f(x)=2x−2−5f(x)=2^{x-2}\color{#8925AE}{-5}. This is the vertical transformation. If it's positive we move the graph up and if it's negative we move the graph down. Since this is negative, we move the graph five units down.

y=2^{x-2}-5

Made using Desmos

Illustrated · 1 min

Graphing Exponential Equations

An exponential equation is a function where the variable is the exponent:

y=axy=a^x

In this equation, aa is a positive real number, and it's called the base. The graph of the equation creates a smooth curve that increases or decreases quickly.

To know if the graph is increasing or decreasing:

  • If a>1a>1, the graph shows exponential growth, meaning it curves upward as xx increases.
  • If 0<a<10<a<1, the graph shows exponential decay, meaning it curves downward as xx increases.
Graphing Exponential Equations
y=3x

3 is the base. Because 3>1, the graph shows exponential growth (not exponential decay).

The graph passes through (0,1) because any number raised to the power of 0 is 1.

The horizontal asymptote is at y=0.

To graph an exponential equation, it’s easiest to create a table of values and plot those points.

Made using Desmos

Every exponential graph passes through the point (0,1)(0,1) because any number raised to the power of 00 is 11. The graph will also have a horizontal asymptote, usually at y=0y=0. That means that the curve gets close to the xx-axis, but never touches it.

The best way to graph an exponential equation is to make a small table of values for xx, plug them into the equation, and find the matching yy values. Then, plot the points on a coordinate plane and connect them with a smooth curve.

Type a concept, like “slope” or “photosynthesis”.

↑ ↓ to choose · Enter to openSearch explanations and problems