Interactive · 7 questions
+3 contributors



What are residuals?
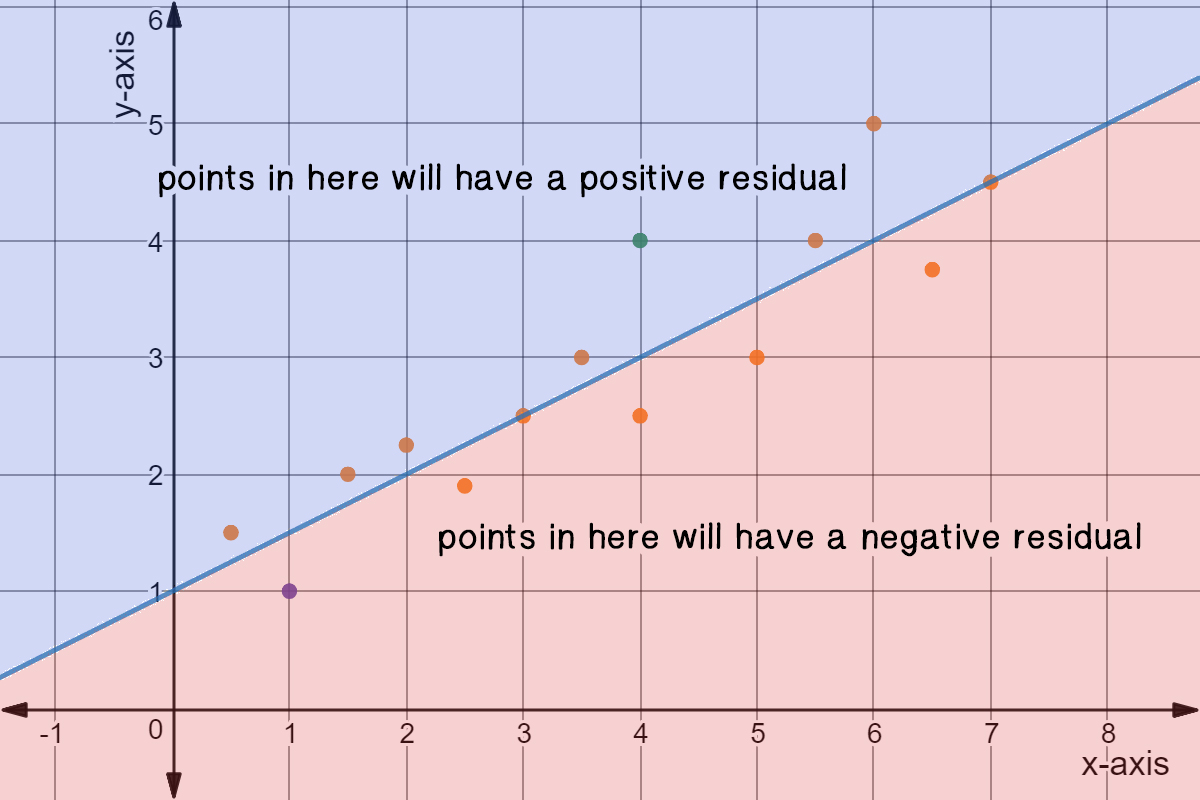
A residual is the difference between the actual value of a data point and the predicted value suggested by a regression line or trend line.
Trend lines are approximations of the shape of the data and show the overall pattern the data takes. Lines of best fit are the most accurate trend lines.
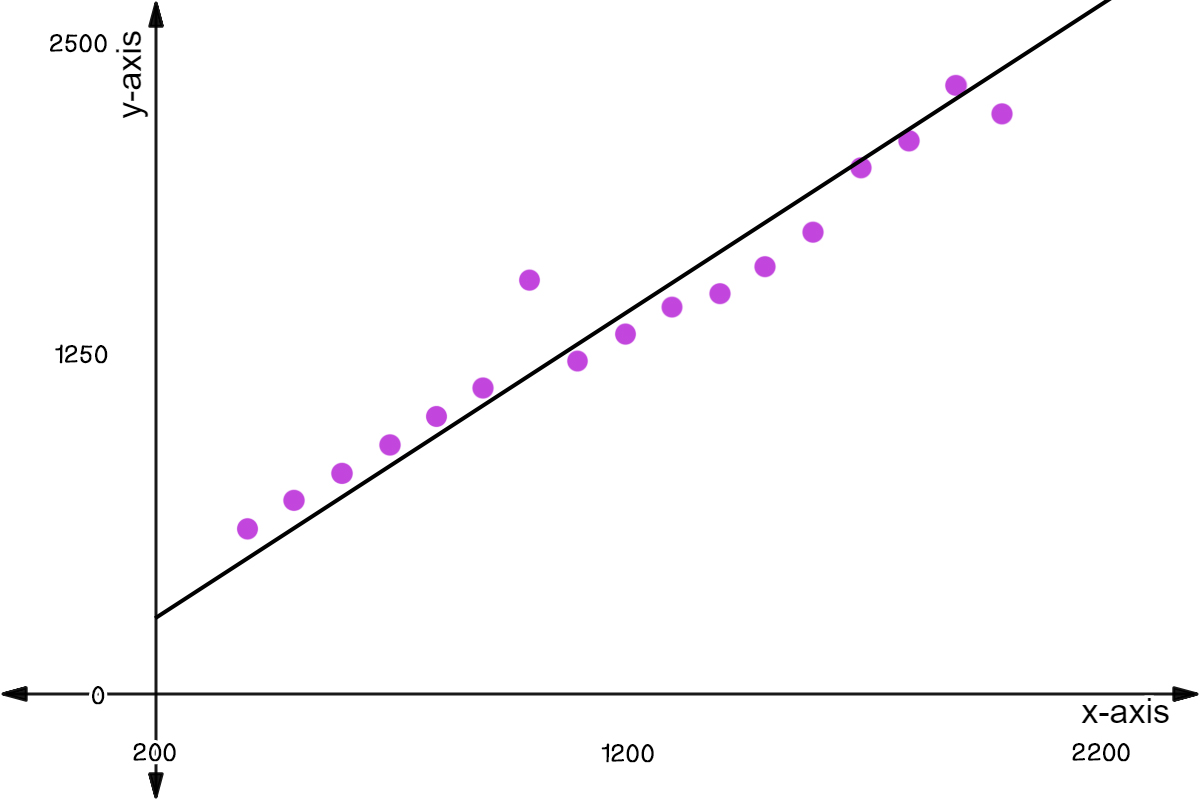
Image source: by Hannah Bonville
Notice, though, that not all data points fall exactly on the best fit line. That's where we get residuals from.
Predicted Value vs. Actual Value
Residuals are calculated as the difference between a point's actual (measured) value and its predicted value.

Image source: by Hannah Bonville
This concept may seem familiar to you if you're a science nerd! If you know about percent error, then it's a very similar concept. If you haven't learned percent error yet, that's okay! You'll be familiar with it because you'll have learned about residual values.
Let's practice identifying predicted and actual values. We'll use the scatter plot and trend line below:

Made using Desmos
Find the purple point on the scatter plot. This represents one person's data.
What is the actual number of years of education this person has?
What is the predicted number of years of education this person (purple) has, based on the best fit line?
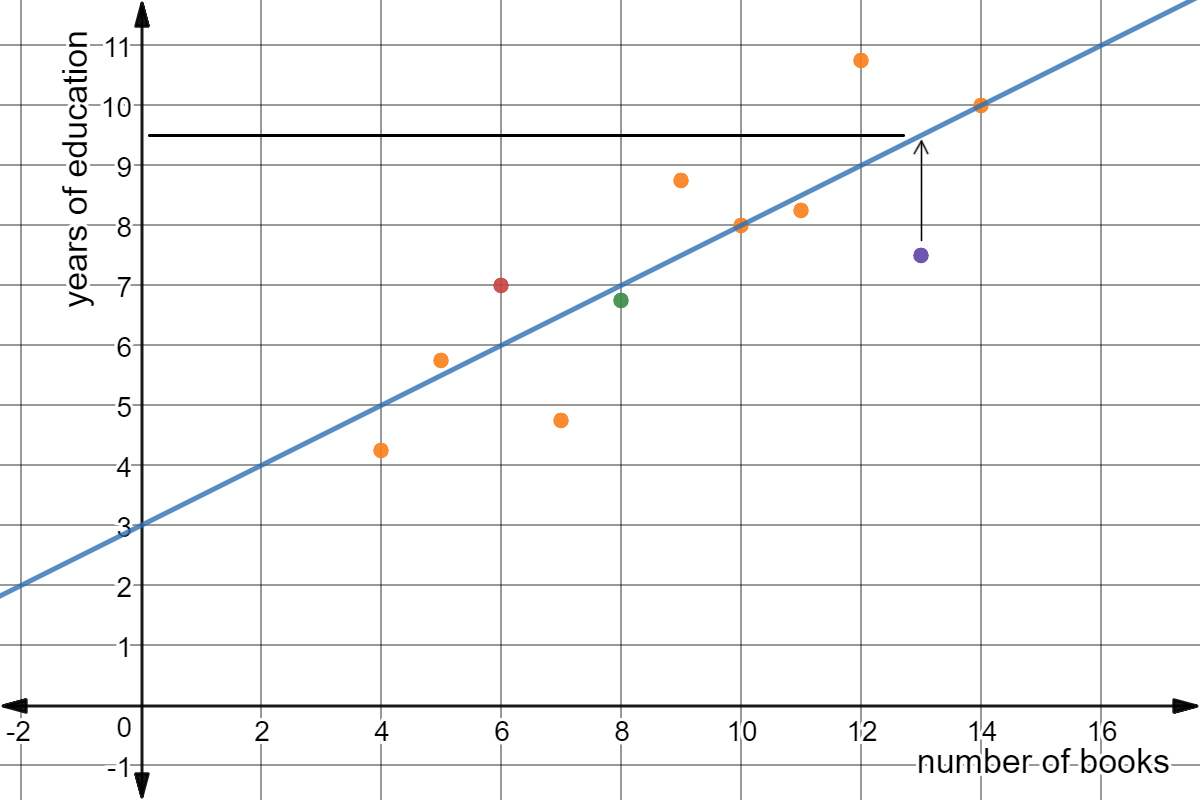
Made using Desmos
Calculating Residual Values

Image source: by Hannah Bonville
So, here's what we know about the years of education of the purple person:
- Actual number of years:
- Predicted number of years:
What is the residual?
This brings us to an important rule:
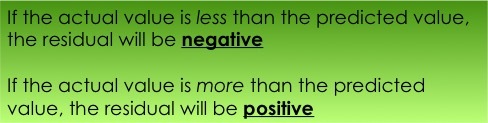
Image source: by Hannah Bonville
Examples
So, now that we've got that in mind, let's try a few more examples. I'm going to put the original scatterplot picture below again, just so you don't have to keep scrolling up and down.
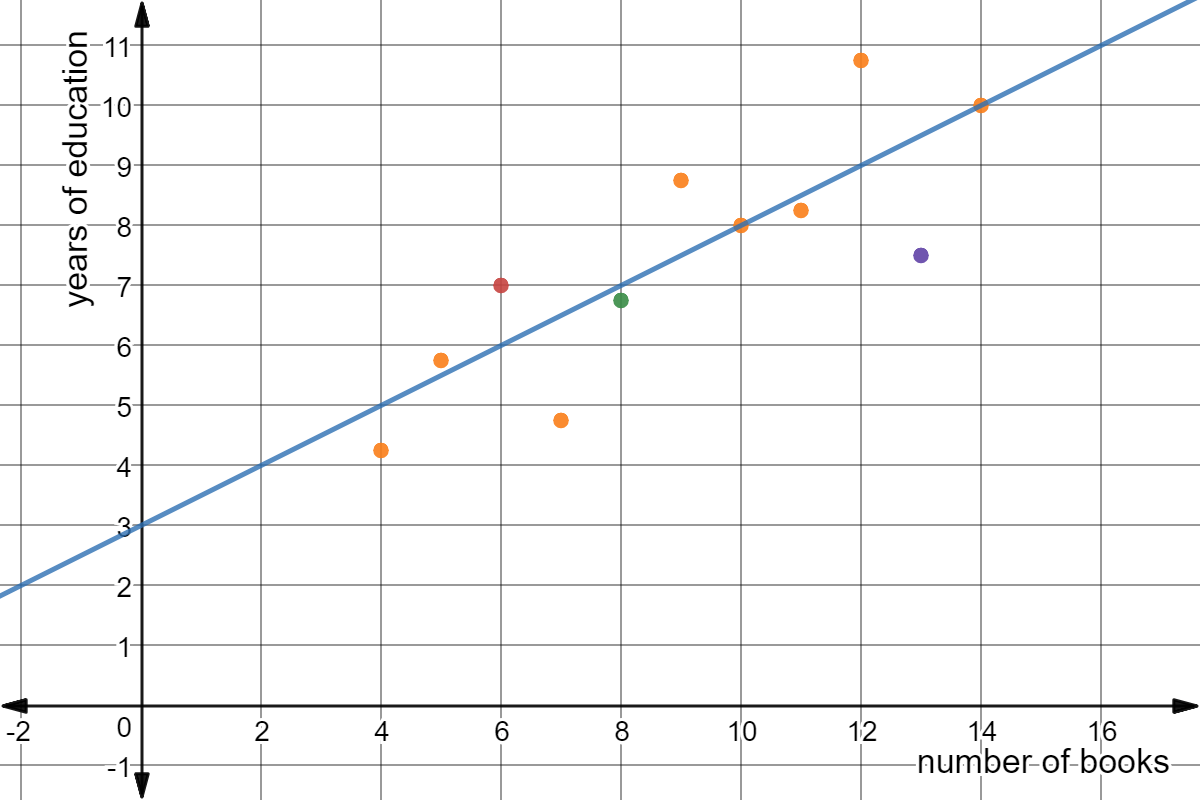
Made using Desmos
Find the red point on the graph.
What is the actual years of education for this person?
What is the predicted years of education for this (red) person?
Here's what we know about the red person:
- Actual years of education:
- Predicted years of education:
Would you expect the residual to be positive or negative?
What is the residual for the red person?
In the real world, you'll use this concept when you're looking at leasing cars and evaluate the value of different things.