Interactive · 1 question
+1 contributors

Sometimes, instead of there being a clear value which has the most data around it - like an ice cream truck surrounded by children - the data spread themselves out such that there are equally large clumps in multiple places. We call these data sets Multimodal, because they have more than one mode. If the data has two modes it is called bimodal, if it has three, trimodal, and so on.
Strictly speaking, multimodality occurs when two or more values have the same number of data points behind them. There are many times which this might happen - say you're trying to gauge the time which it takes for your class to take a test. Everone knows the test is going to be really hard, so half of the class skips school that day, and the other half takes the whole minute time limit to take the test.
Now we have a situation in which we have two groups of equal size - one which took the whole time ( minutes) and one which didn't take the test at all ( minutes). Let's say your class has people in it. Here's what your data looks like:
Time to completion (in min.):
Students who took the test in minutes:
Students who took the test in minutes:
Because that they are groups of equal size, both are the mode.
Note: Actual studies of test timing would instead mark each of the absent students as "NA" - a missing value - since they never completed the test. Marking them as will throw off measures like the mean because it gives the impression that students completed the test quickly. For example, this study would tell you the average student took minutes to complete the test, which is way faster than any student actually did. Since many people rely on summary statistics to represent data sets which they cannot see for themselves, such an error would be disastrous - after all, if you told the teacher that the average person only took minutes to complete the test, she might make that ridiculously hard test even harder!
Try it yourself!
What are the modes in this data set?
Data:
A Word to the Wise about Modality:
Most researchers don't actually care about the strict mode of the data - the value which takes the most data points - but rather the general "mounds" of data points which exist in your samples.
What do I mean by mounds? Look at this graph:
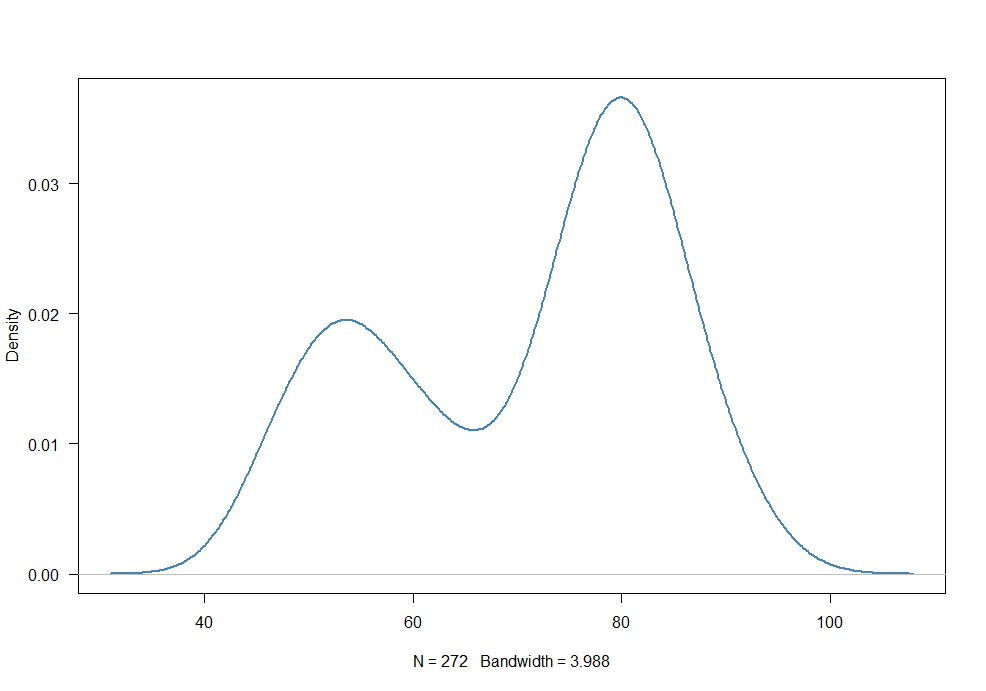
Image by COOLSerdash via StackExchange
This distribution, which is a density graph (the y axis represents the percentage of data which take each x value), is clearly bimodal, with one mode at around , and the other at , despite the fact that one mode (the first mound, at ) is much smaller and has less data than the other.
Applying the normal rules for Mode, you would only report the mode with more data behind it, the mode at . But the clump at is just as important.
Because multimodality indicates that there are many large clumps of data, it is important to know all the clumps, even if some are not as large as others.