Graphing a Log Function
A logarithmic function is the opposite of an exponential function.
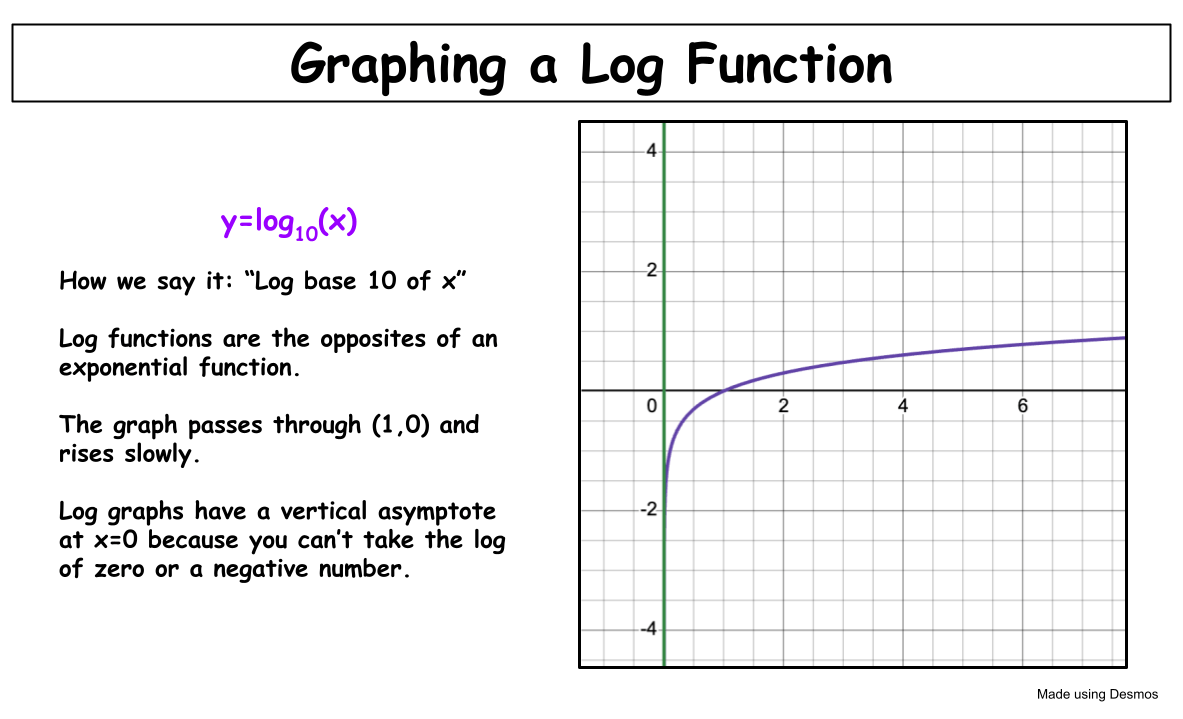
The most basic log function is:
y=logb(x)
We verbally say, "log base b of x". That is exactly what this function is: a logarithm with base b of x. It tells us to what power we raise b in order to get x.
To graph a log function, it helps to make a table of values. Choose x values that are powers of the base, then solve for y. For example, if b=10,
- log10(1)=0
- log10(10)=1
- log10(100)=2
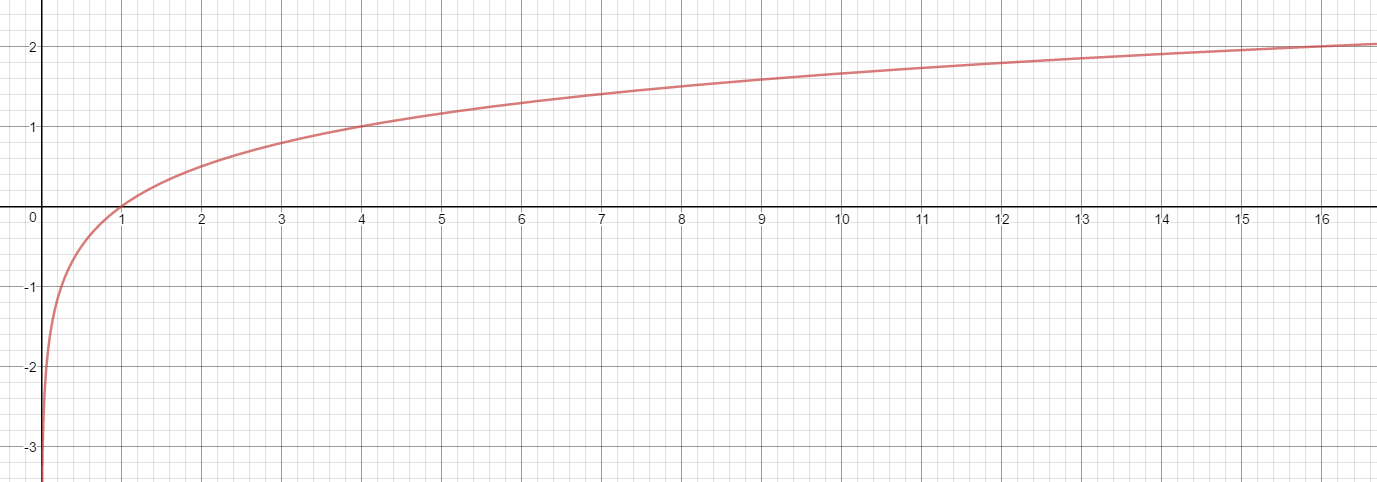
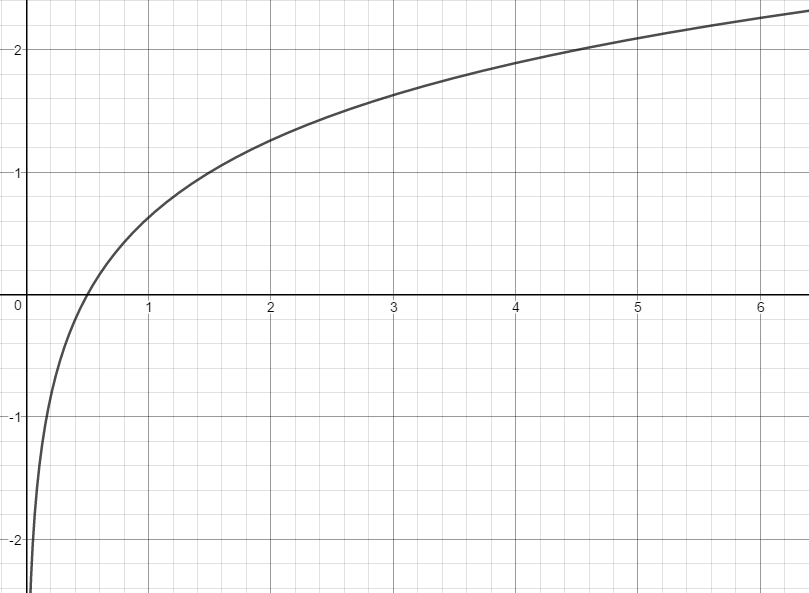
Plot those points on the graph. You'll notice that the graph passes through the point (0,1) and rises slowly as x increases.
Log graphs will always have a vertical asymptote at x=0 because you can't take the log of 0 or a negative number. The graph gets very close to the y-axis but never touches it.
If you're curious, you can also learn how to find the range and domain algebraically.