Interactive · 1 question
+3 contributors


Checking to see if a graph is a function
The vertical line test checks to see if a curve on a graph can be described as a function. Functions are defined as having at most one value for any one value, so if there's ever a place on a graph where there are two values of for one value of , that curve can't be described as a function.
We can check graphs for this by taking a vertical line and passing it horizontally over the graph, looking at where the vertical line intersects with the graph. If there's ever a place where the line intersects more than once, the curve on the graph fails the test and can't be described by a function.
For example, look at the graph below:
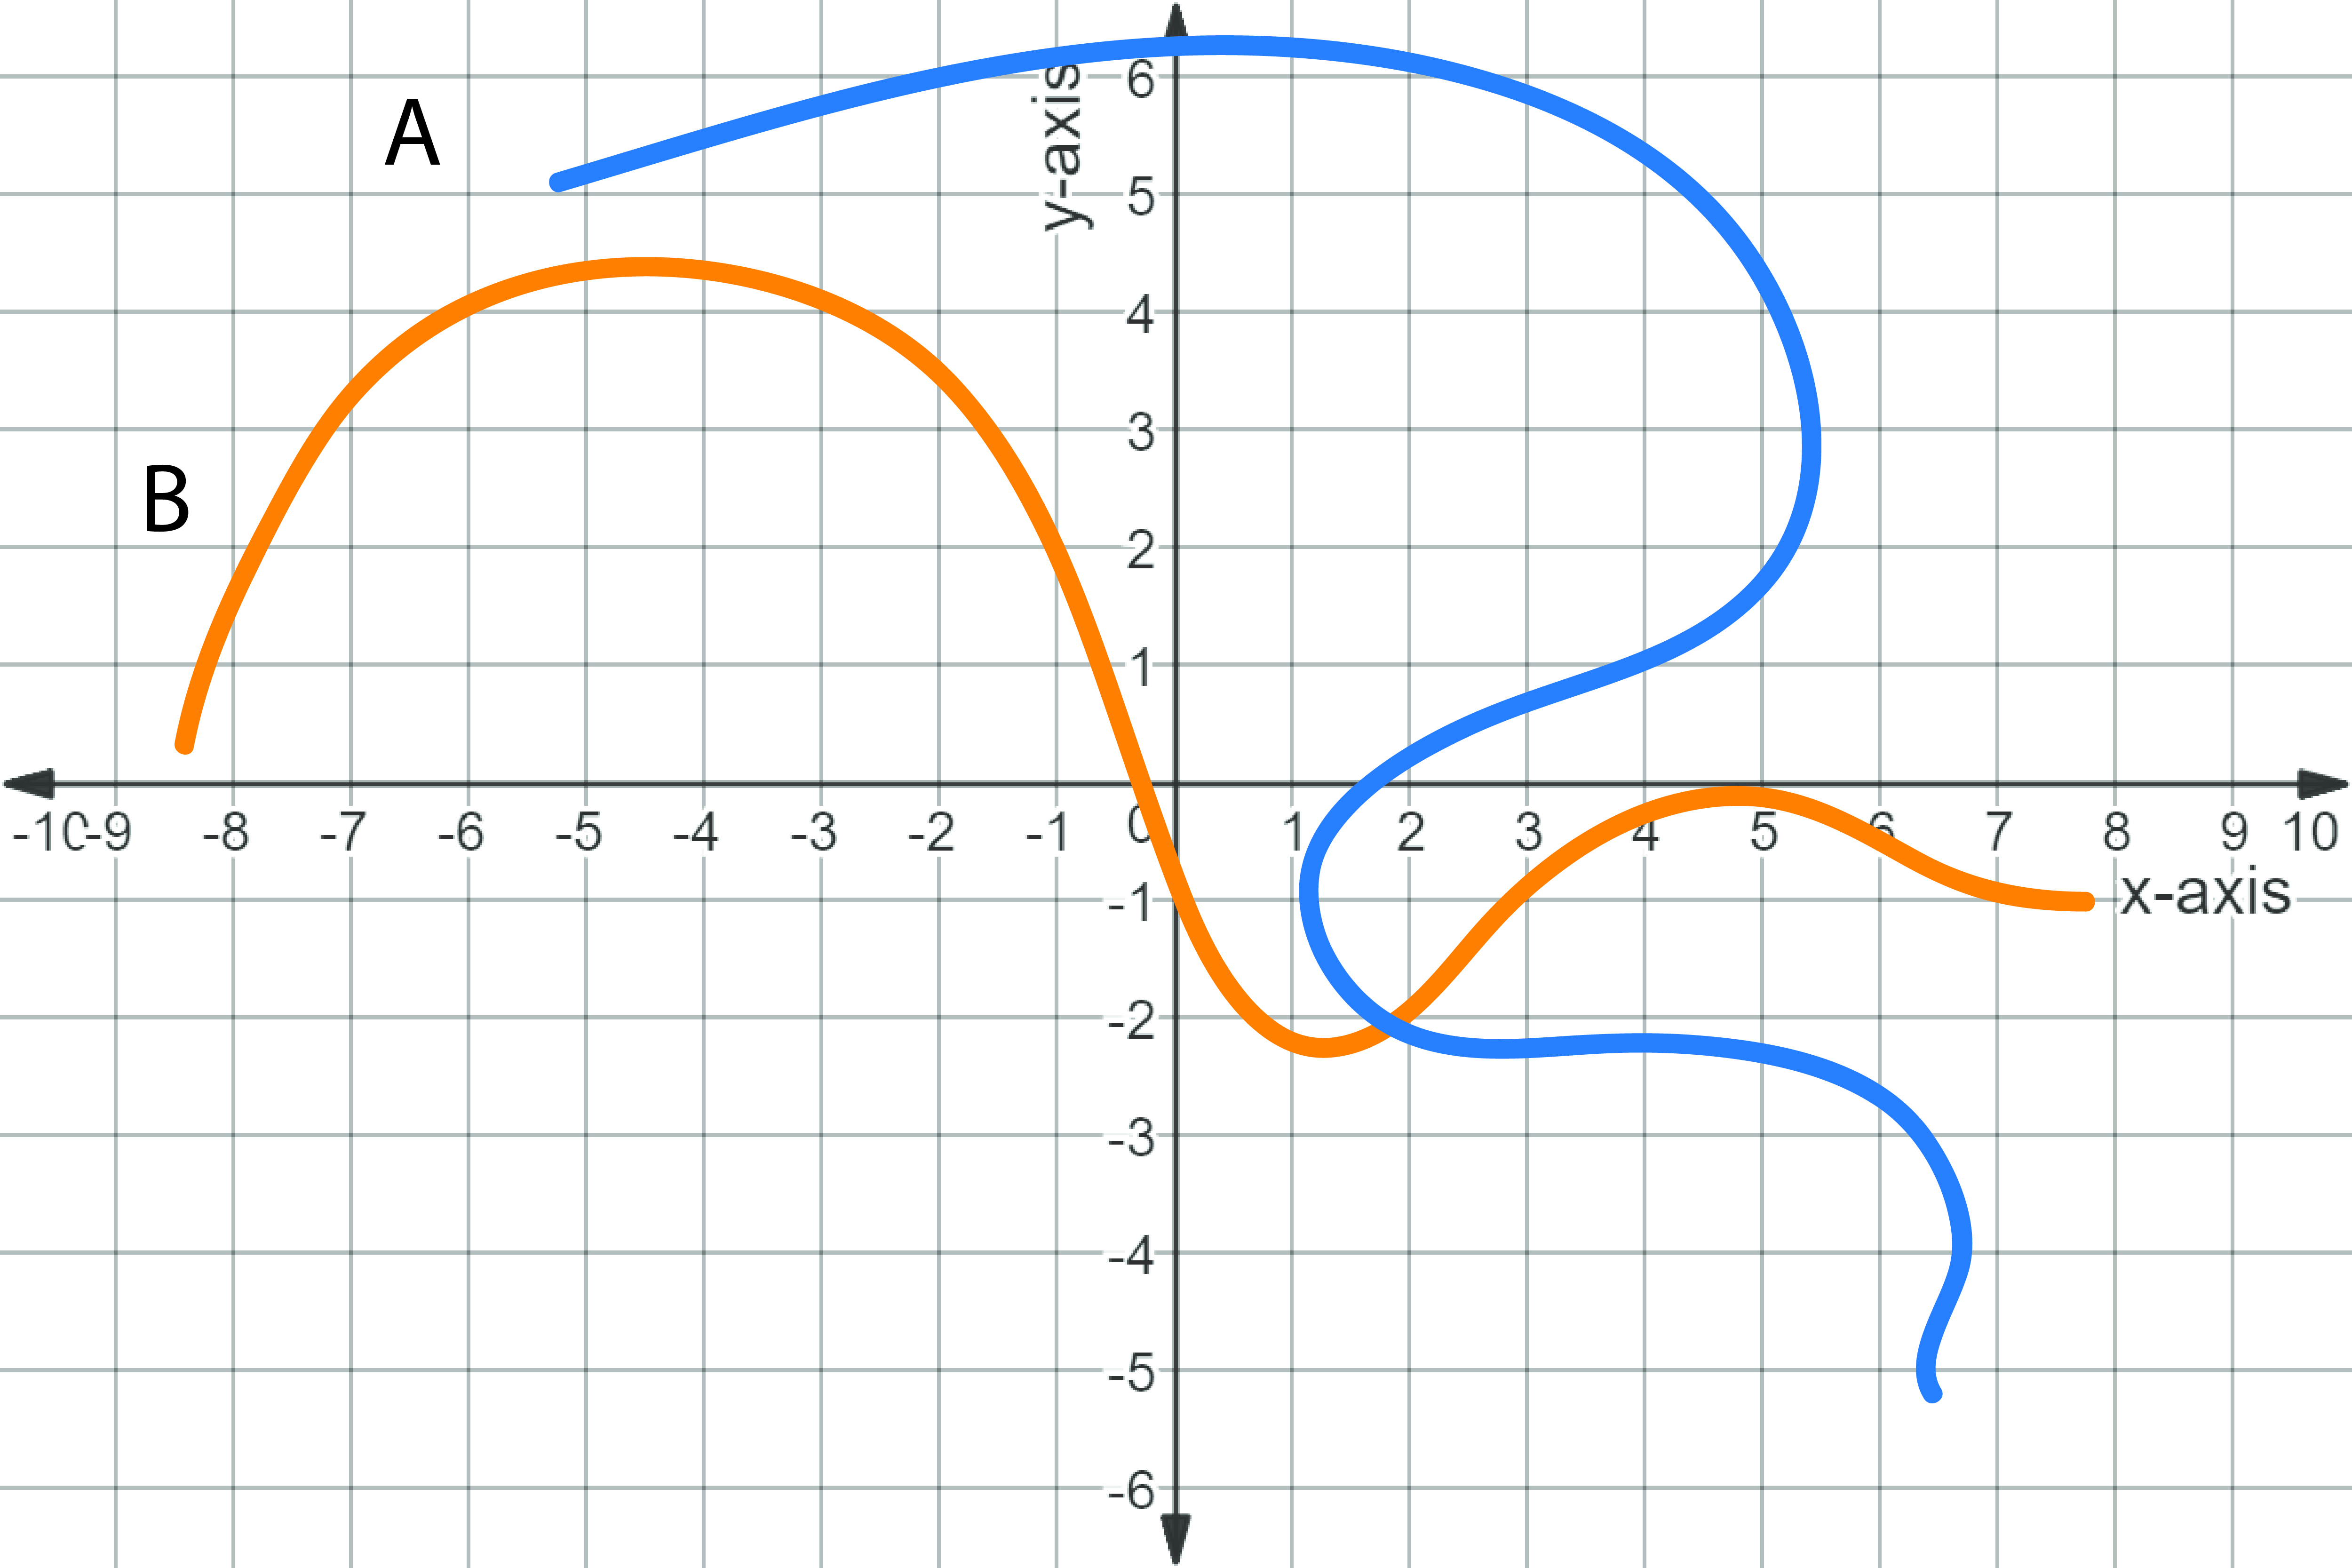
Which of the curves above is not a function?
In the graph above, curve B could represent a function, while curve A could not. If you look at the image below, you'll see that the red vertical line passes through curve A three times at the -value of At other -values, like or this is also the case. This means the curve fails the vertical line test, and graphs that fail the vertical line test cannot match functions because they have more than one value for some value(s) of
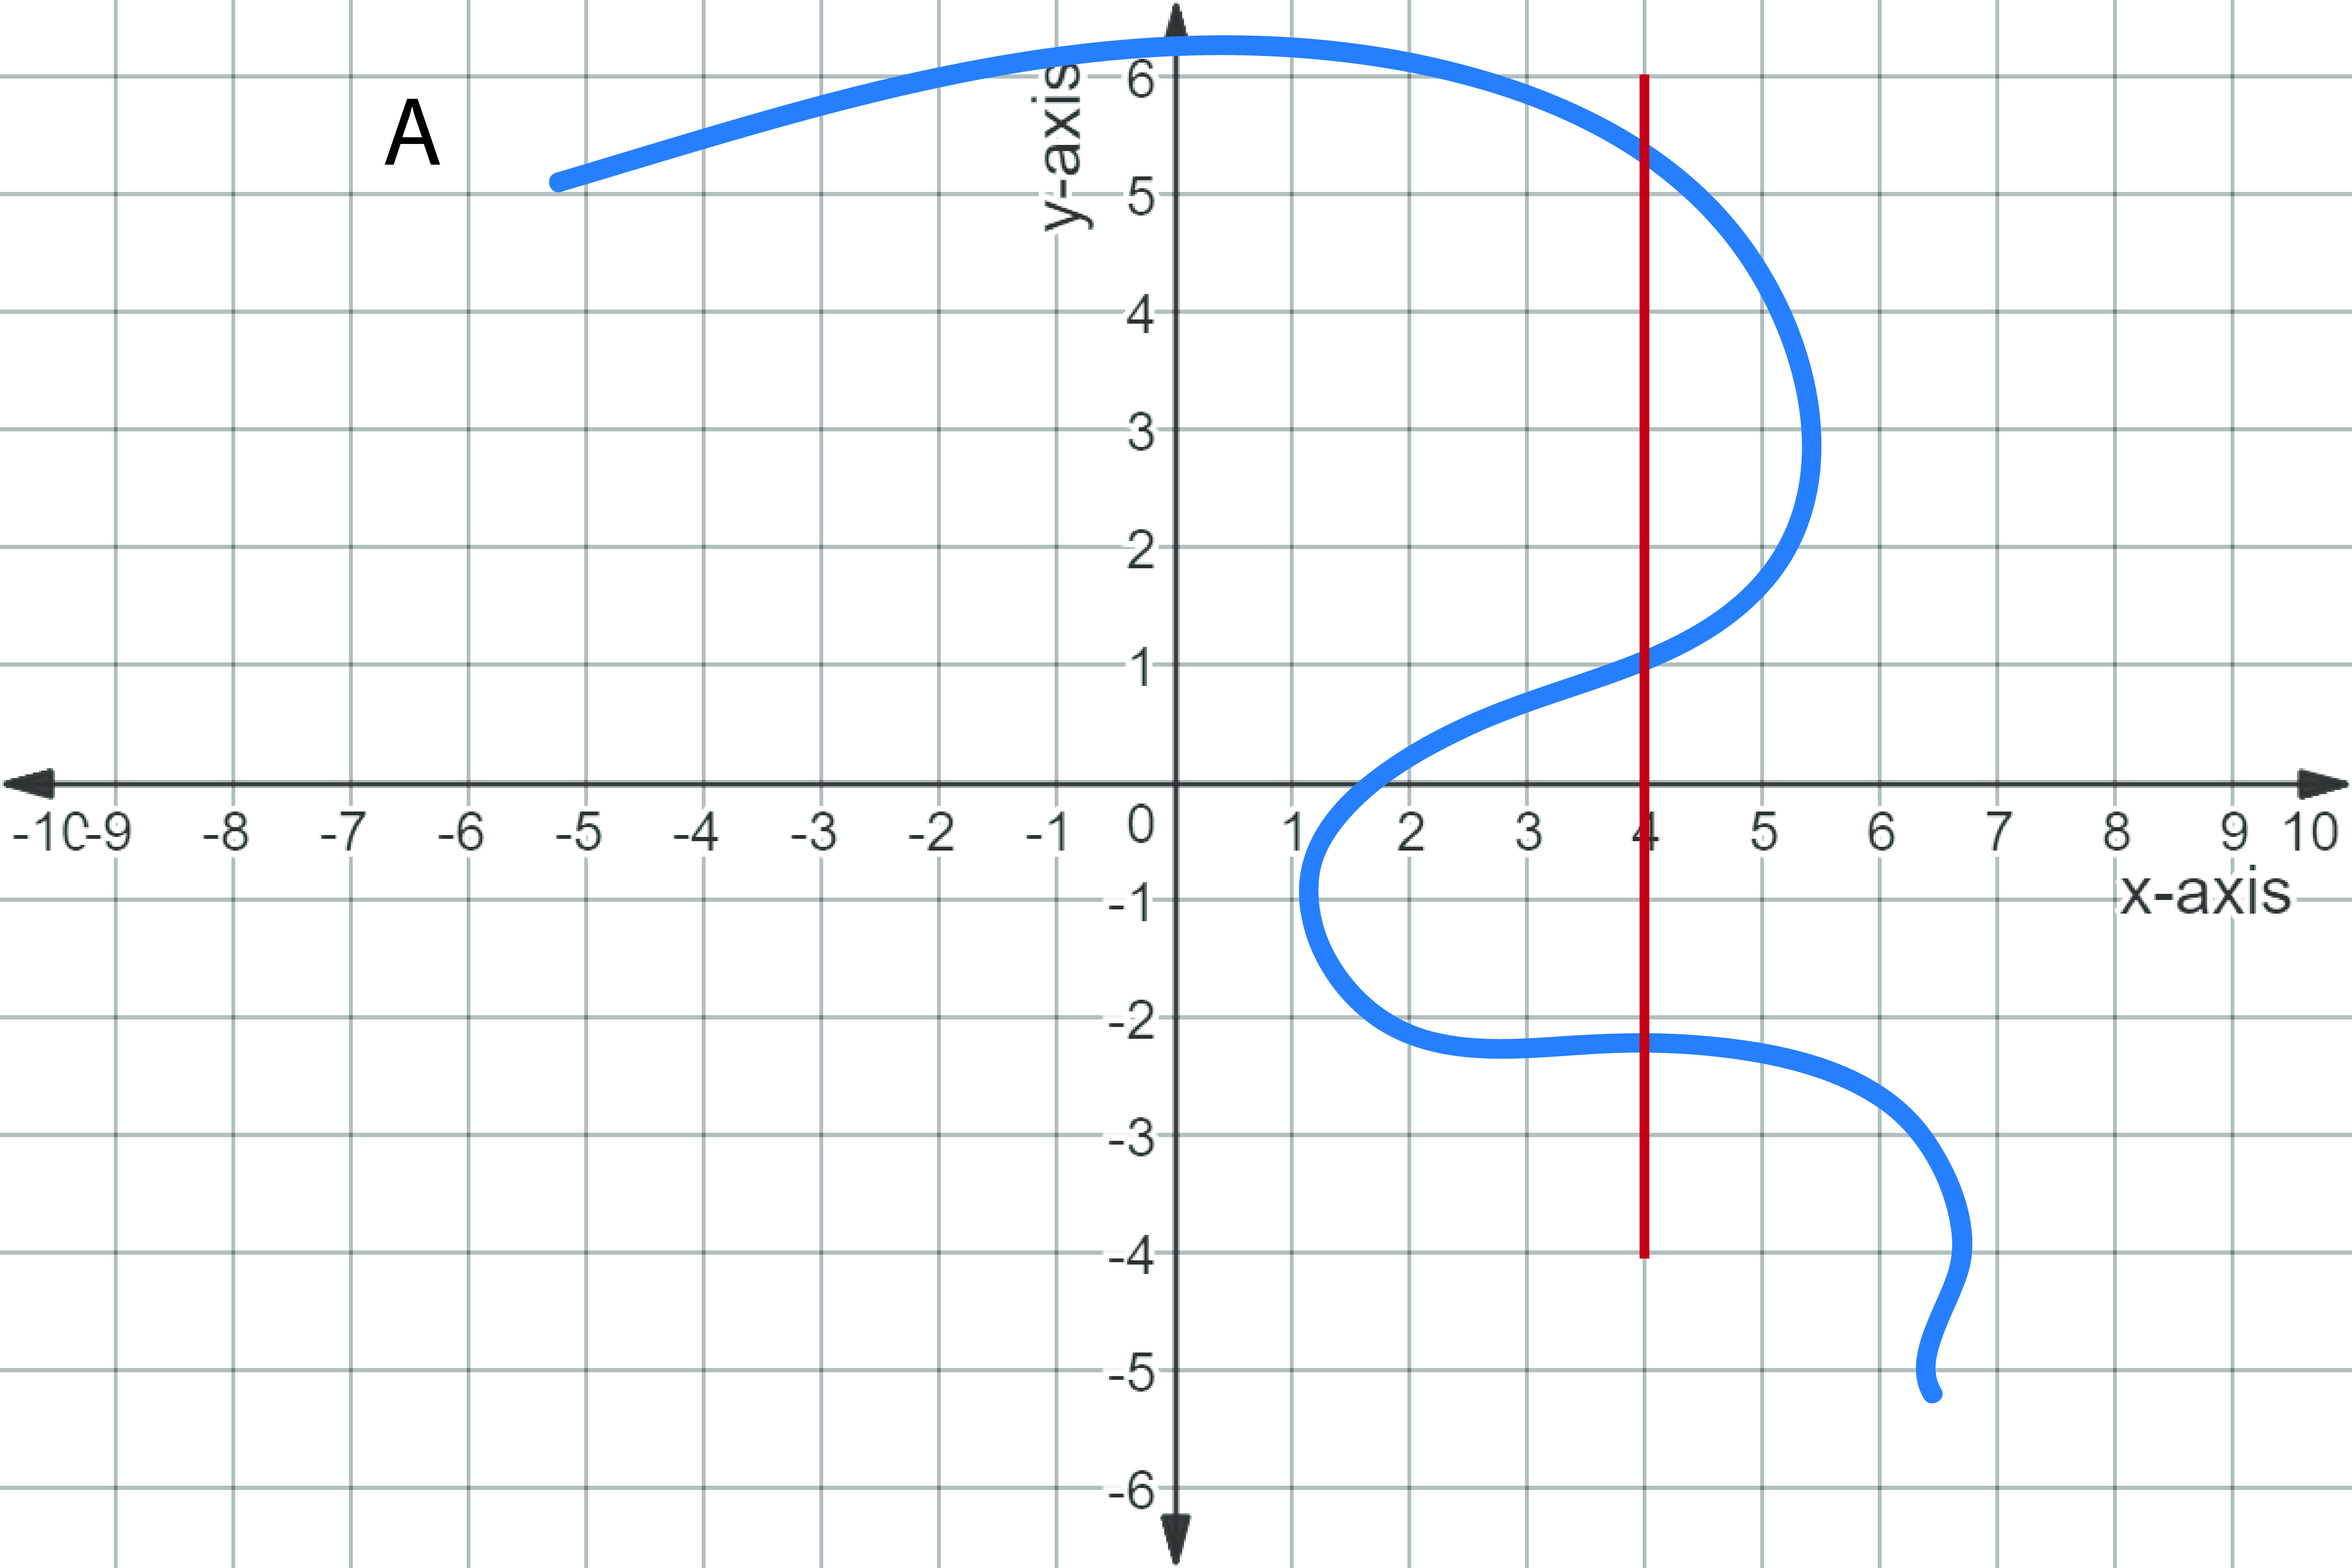
Curve A fails the vertical line test at , as well as many other places (including everything between and ).
