Video · + 1 min read

(Video) Graphing Roses

by ossmteach

Watch this video by ossmteach to learn more about graphing rose curves!

Rose curves follow the forms of the equations:

r=acos⁡(nθ)r = a\cos(n\theta) r=asin⁡(nθ)r = a\sin(n\theta)

When nn is odd, there are nn leaves.

When nn is even, there are 2n2n leaves.

aa is the distance from the center to the end of the leaf.

For example, with the equation r=acos⁡3θr = a\cos{3\theta}, we will see three leaves on the rose curve.

With the equation r=acos⁡4θr = a\cos{4\theta}, we expect to see 8 leaves.

To graph a rose curve, the main strategy is to plug in easy θ\theta values, then solve for r and plot the points.

Let's work through the example in the video together!

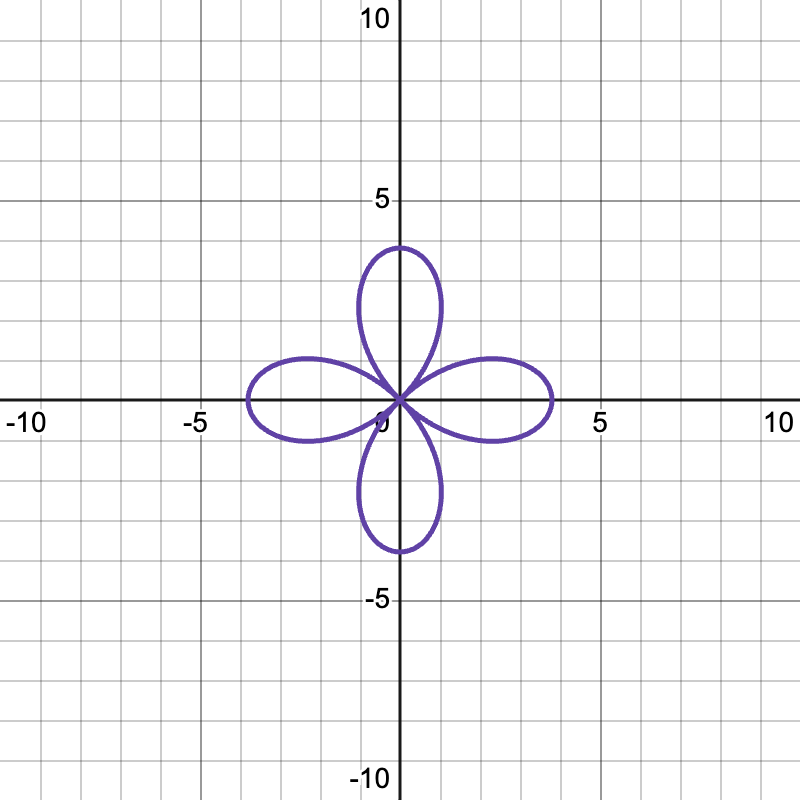
r=2sin⁡(2θ)r = 2\sin(2\theta)

From the equation, we know there are 4 leaves and the distance from the end of the leaf to the center is 2.

When θ=0\theta = 0, r=0r=0. When θ=π4\theta = \frac{\pi}{4}, r=1r=1. Keep trying different θ\theta values and then you can plug these numbers in on the graph and connect them to develop the rose. The unit circle trigonometric values will be very useful.

Illustrated · 1 min

We've learned that we can use the polar equation to graph circles, limaçons, and cardioids. We can also use polar equations to graph roses!

Rose Curves

Rose curves sound exciting! You may be wondering if they actually look like roses. Well, you be the judge for yourself!

Graph of a rose curve

Made using Desmos

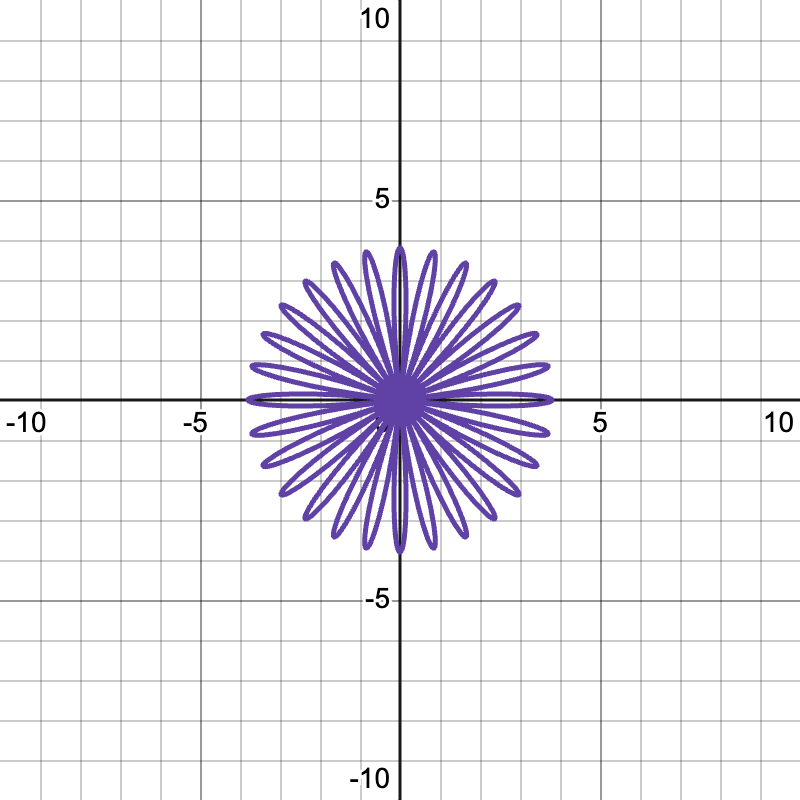
This looks like a flower! That's cool. We can make this flower more complex.

Graph of a rose curve

Made using Desmos

Rose curves, also known as rhodonea curves, is a type of sinusoid that is graphed with polar coordinates. The typical equation used to graph rose curves is: r=acos⁡(kθ)r=a \cos (k\theta) , where rr is the radial coordinate, kk is the angular frequency, aa is the amplitude, and θ\theta is the polar angle. kk will tell you the number of "petals" in the rose curve. If kk is even, the rose curve will have kk petals. If kk is odd, the rose curve will have 2k2k petals.

If you ever encounter a situation where the coordinates aren't in the form you need, don't sweat! Remember that you know how to [convert from polar to rectangular and from rectangular to polar!

A rose curve will always be symmetrical about the origin and has a period of 2π2\pi.

We can also express a rose curve using sine, which is the cosine curve but rotated counterclockwise by π2k\frac{\pi}{2k} radians.

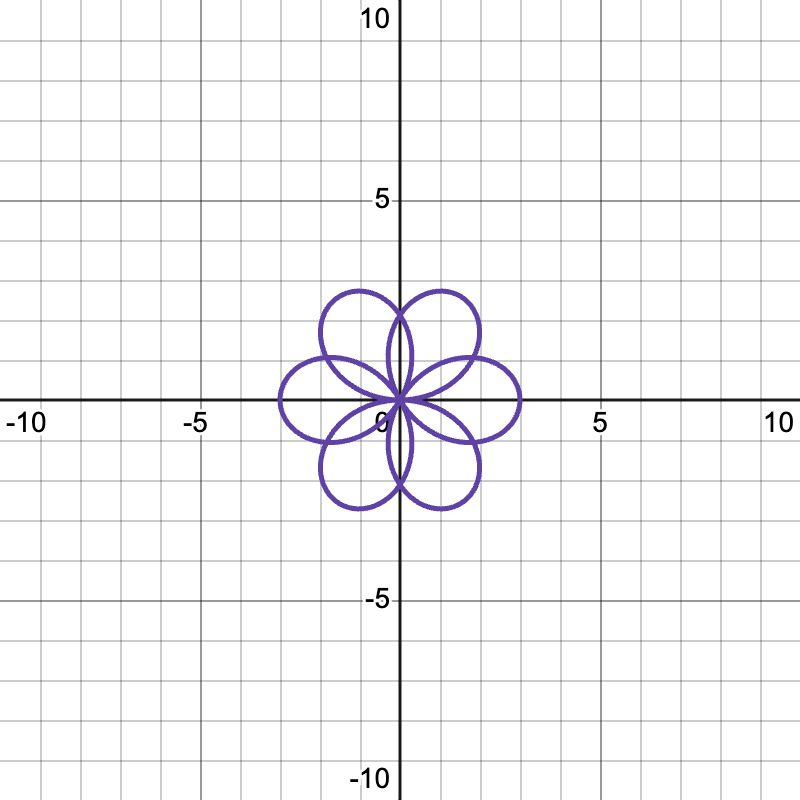
Here is the graph of the following equation: r=3cos⁡(1.5θ)r=3\cos(1.5\theta)

Graph of a rose curve

Made using Desmos

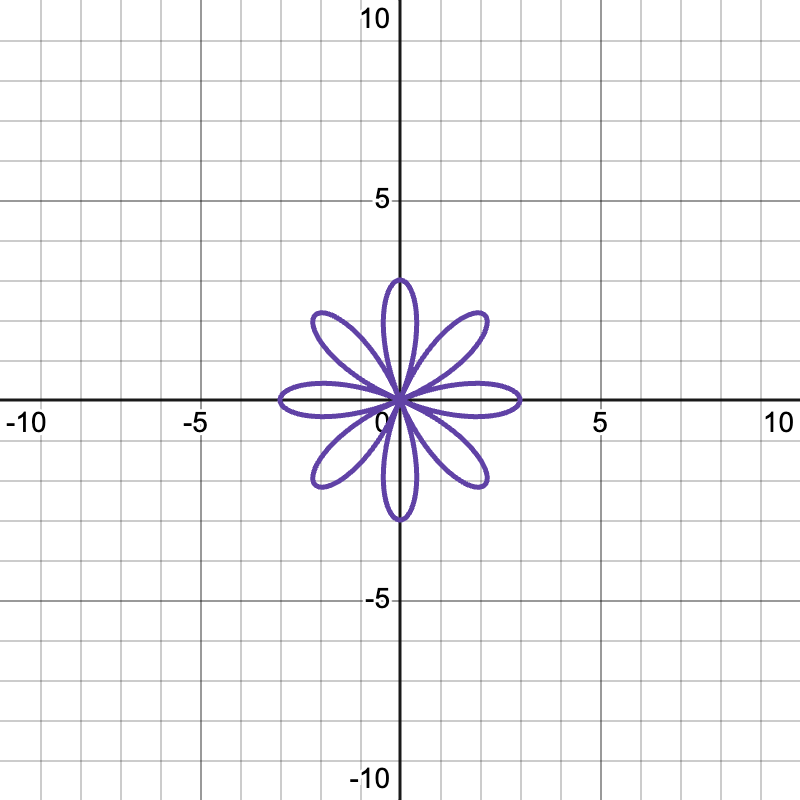
Let's say we want to increase the angular frequency to 44, yielding the equation: r=3cos⁡(4θ)r=3\cos(4\theta). Our graph looks like:

Graph of a rose curve

Made using Desmos

As you can see, the radius and amplitude stayed the same, but the number of petals have increased!

In the next lesson, you'll learn about lemniscates!

Illustrated · 1 min

Rose Curves

A rose curve is a graph that looks like a flower with petals. You can graph rose curves using a polar equation, like so:

r=acos⁡(kθ)r=a\cos(k\theta) r=asin⁡(kθ)r=a\sin(k\theta)

Cartesian coordinates will not work when graphing rose curves.

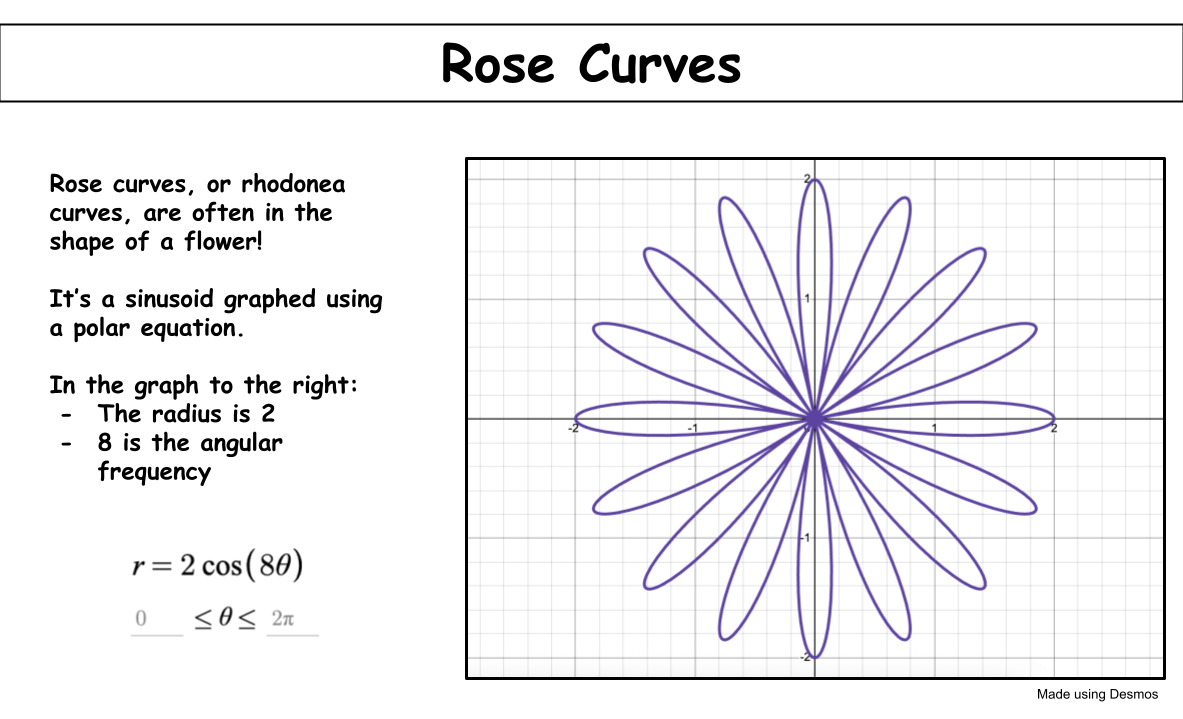
Rose curves, or rhodonea curves, are often in the shape of a flower!

It’s a sinusoid graphed using a polar equation.

In the graph to the right:
The radius is 2
8 is the angular frequency

Made using Desmos

In the equations, aa will tell you the length of each petal and kk will tell you the number of pteals.

If kk is odd, the rose will have kk petals. If kk is even, the rose will have 2k2k petals.

For example, r=3cos⁡(2θ)r=3\cos(2\theta) makes a rose with 44 petals, each 33 units long.

The petals are spaced evenly around the origin and always pass through it. Rose curves are symmetric and look like real flowers when drown on polar graph paper. These curves are called "rose curves" because of how they look, but they follow simple math rules.

Type a concept, like “slope” or “photosynthesis”.

↑ ↓ to choose · Enter to openSearch explanations and problems