Video · + 1 min read
(Video) Graphing Roses
by ossmteach

Watch this video by ossmteach to learn more about graphing rose curves!
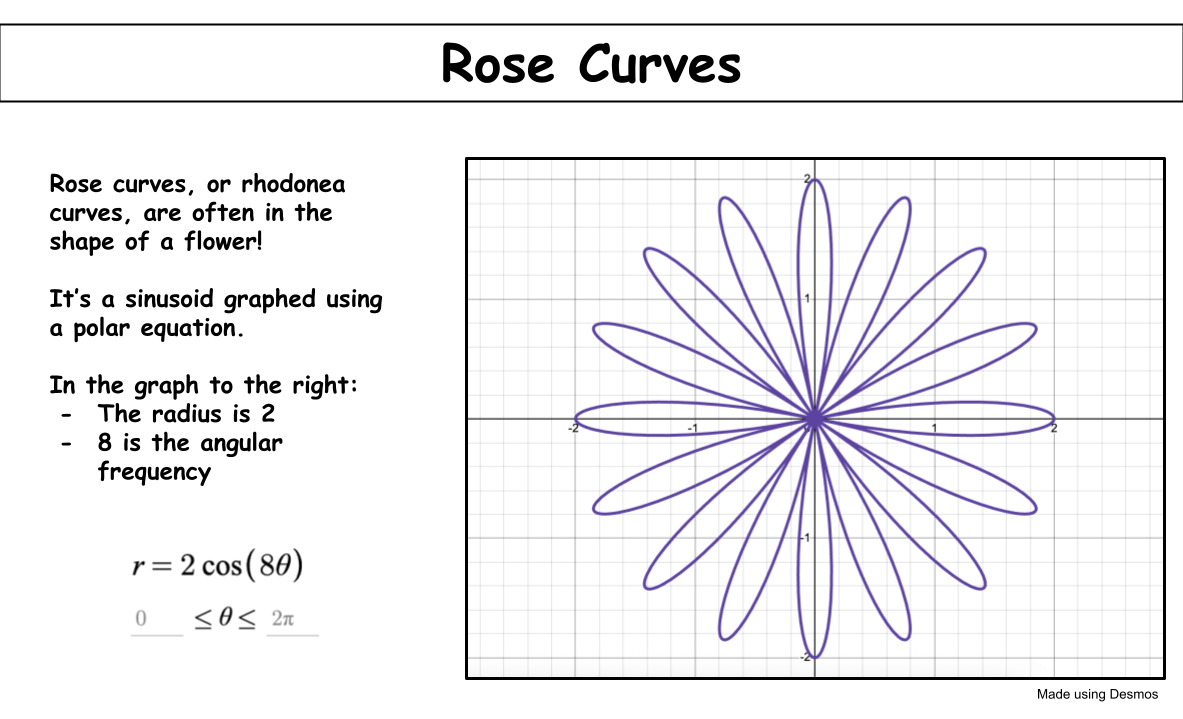
Rose curves follow the forms of the equations:
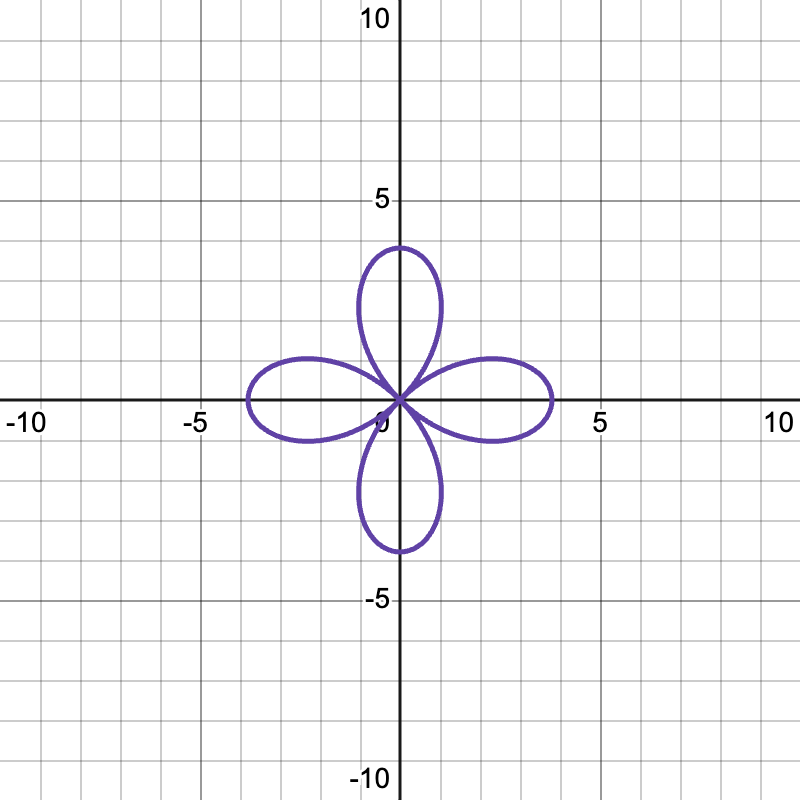
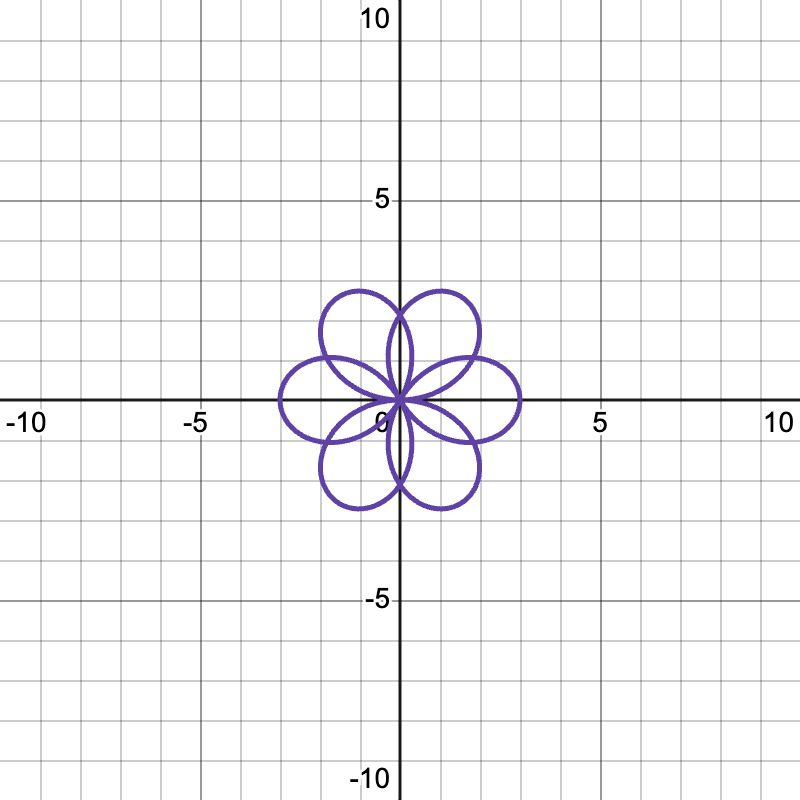
When is odd, there are leaves.
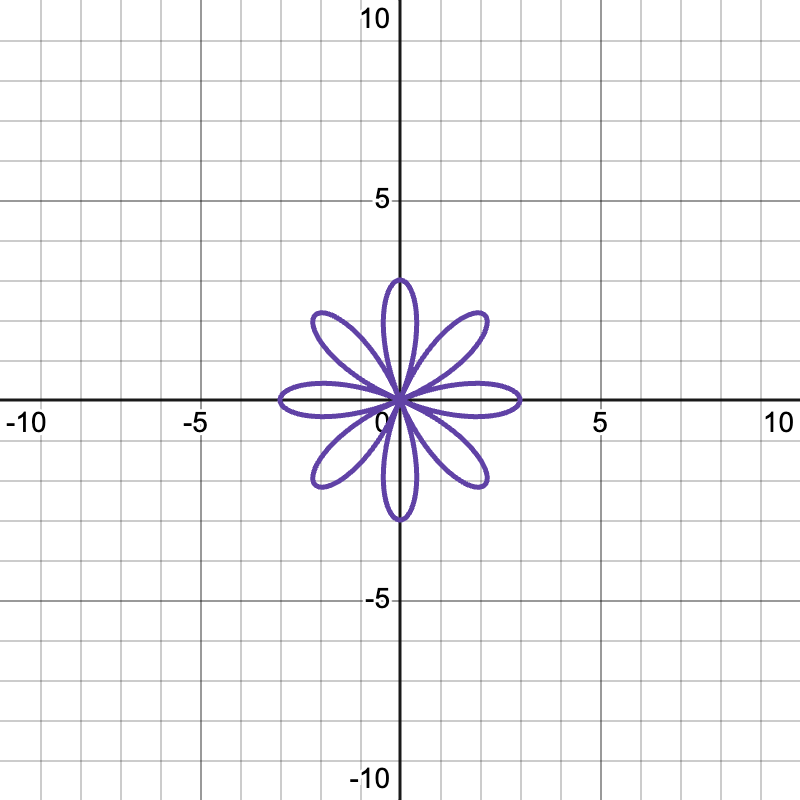
When is even, there are leaves.
is the distance from the center to the end of the leaf.
For example, with the equation , we will see three leaves on the rose curve.
With the equation , we expect to see 8 leaves.
To graph a rose curve, the main strategy is to plug in easy values, then solve for r and plot the points.
Let's work through the example in the video together!
From the equation, we know there are 4 leaves and the distance from the end of the leaf to the center is 2.
When , . When , . Keep trying different values and then you can plug these numbers in on the graph and connect them to develop the rose. The unit circle trigonometric values will be very useful.