From the start, chemistry has been about energy. Even in the 1700s, chemists were observing gases and measuring their ability to do work. In the modern era, we began to apply energy to electrons. Bohr's model considered electron orbits based on energy quanta. As quantum mechanics developed, we thought about electrons in terms of orbital energy levels. Eventually, we started to model covalent bonding. When covalent bonds break and reform, it's all about energy.
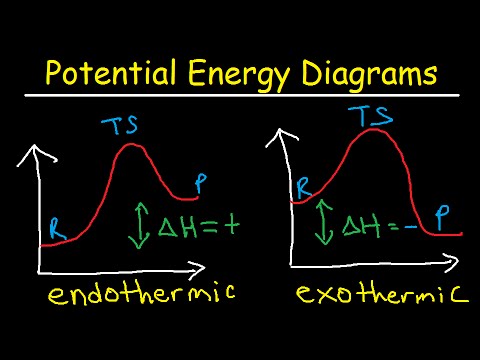
Today we'll look at energy diagrams. They show how energy changes during a chemical reaction. This written explanation will describe each part of an energy diagram. But, if you need a visual, look at our image description too.
Energy Diagram Metaphor
Unfortunately, running up a hill is an excellent metaphor for chemical reactions.
I hate running! I know some people love it. But, I think it's boring. I'll gladly run if I'm playing a sport. But, pure running, no. When I was in college, I took a distance running class. It confirmed that I despise running. Sometimes we learn the hard way. I remember we had to run up a huge hill. It was so long and steep. At the top, you were gasping for breath. But, the top was a nice transition. The next part was downhill. It was easy! It's oddly similar to chemical reactions!
Parts of an Energy Diagram
The x-axis:
The energy diagram's x-axis is called the reaction coordinate. The reaction coordinate gauges the reaction's progress. But, it's not time. The reaction coordinate is abstract! It changes for different chemical reactions. We might measure bond length, bond angle, or the number of bonds formed. It depends on the chemical reaction! At our level, we typically write reaction coordinate. We know it's some measure of the reaction's progress. As you advance, your teacher might be more specific.
The y-axis:
The y-axis is energy. More specifically, it's potential energy. Remember, potential energy comes from electrostatic interactions. Molecules store it in their bonds. So, as the bonds break and reform, the graph's energy changes.
The Products and Reactants:
At the graph's beginning and end, you'll see flat lines. The beginning line is the reactant's starting energy. The ending line is the final products' energy. But why are they flattened? At the products, our reaction's finished. Its energy doesn't change. So, the line is flat. The reactants line is a little trickier. It's a convention. The moment we mix our reactants, the reaction begins. So, our curve should start immediately. The reactant's line shows their energy before mixing.
An energy diagram also gives thermodynamic information. We compare the reactants' and products' positions. If the reactants are higher up the y-axis, the reaction is exothermic. The reactants released heat to form the products. If the products are above the reactants, it's endothermic. The reactants absorbed heat. The energy difference between the two lines equals the enthalpy change (ΔH). If we were doing the reaction experimentally, we would notice a temperature change.
The Curve:
Between the reactants and products is a hill-shaped curve. The hill's peak is the transition state. The energy change between the reactants and the transition state is the activation energy. Remember, it's the minimum energy required for the reaction. If the system has less, it simply won't go.
Multistep Reactions
We've studied reaction mechanisms. So, we know that reactions happen in many elementary steps. But, how does that change the energy diagram? Each elementary step has its own curve. We connect the curves into one graph. So, our overall reaction produces a chart with multiple hills and valleys. The reactants and products are still at the very start and very end.
But, what are the peaks and valleys? Let's start with the valleys. They're the intermediates! Remember, intermediates are the products for one elementary reaction. But, they're the reactants for the next step. So, each hill follows the pattern. The reactants are at the start. The products are at the end.
What about the peaks? They're the transition states. Intermediates act as reactants. So, they have to go through a transition state. Don't confuse the two! Intermediates are whole molecules or ions. Their bonds have finished forming. But, they are still reactive. So, they become the reactants for the following elementary step. But, transition states are halfway points. They have partially broken and formed bonds. The in-between state has very high energy. So, the transition state is the peak.
The tallest peak is the rate-limiting step. Why? Remember collision theory. We need the molecules to collide with the right orientation and energy. The tallest peak is the step that has the largest energy barrier. So, it determines the reaction rate. What about adding a catalyst? A catalyst lowers the activation energy. So, we would shrink the peak.
Super Advanced Chemistry: Energy Surfaces
If you take physical chemistry, you'll encounter energy surfaces. They are energy diagrams in three dimensions. The y-axis is still energy. But, the x and z axes are different reaction coordinates. An energy diagram is a slice of an energy surface. You don't need to know how they work. But you should know they exist.