Намалювати графік з канонічного рівняння

Before this, knowКанонічне рівняння прямої: написати рівняння

Illustrated · 1 min

Point Slope Form

In the previous section, we learned about slope-intercept form. The next section will look at standard form. This section focuses on the point-slope equation.

The equation of the line in point slope form is: y−y1=m(x−x1)y-y_1=m(x-x_1) Here, mm is the slope, and (x1,y1)(x_1,y_1) is a point the line passes through.

Graphing

To sketch a graph of the equation, all you need to do is pull out the point the line passes through and the slope.

Remember what we talked about with parallel lines earlier: parallel lines have the same slope but different y-intercepts. That same concept applies here, too! We won't look at parallel lines in this lesson, though.

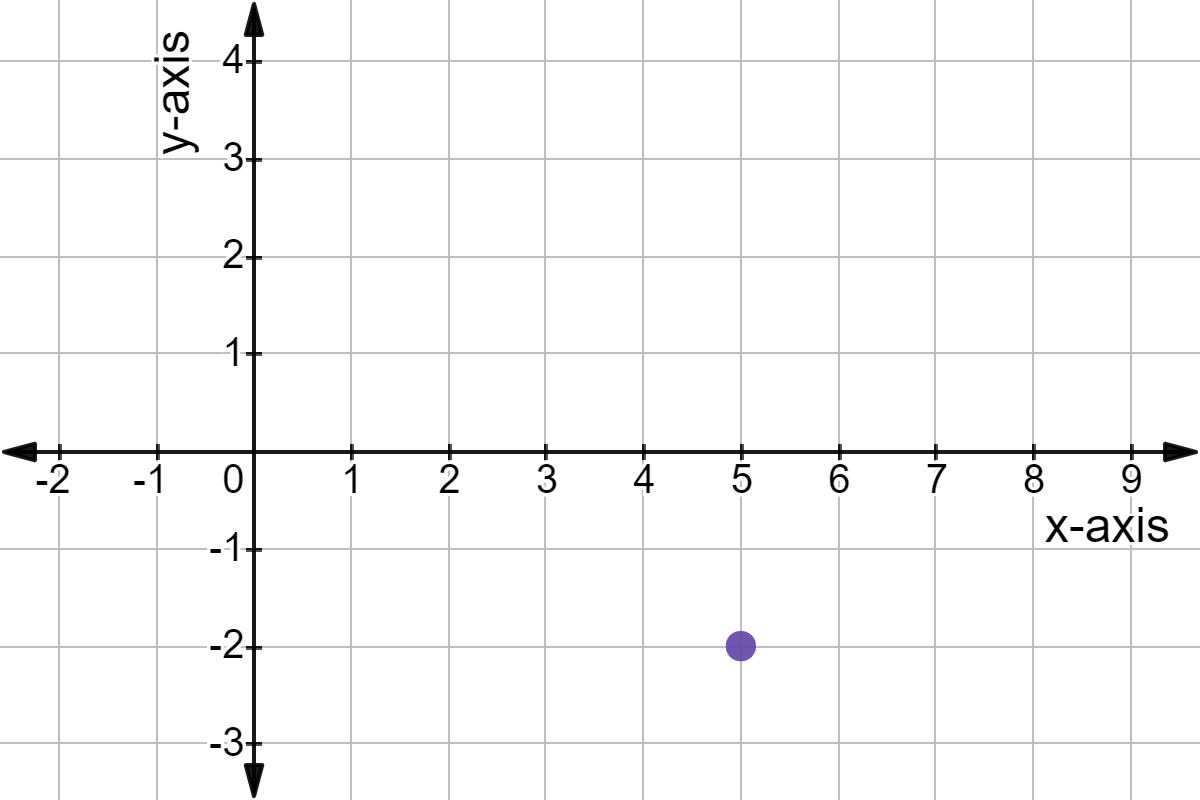
Let's look at an example. Suppose we want to graph the line: y+2=32(x−5)y+2=\frac32(x-5) Pulling out the info we need, we have a slope of m=32m=\frac32, and the point it passes through is (x1,y1)=(5,−2)(x_1,y_1)=(5,-2).

In case you forgot, here's the slope formula: slope=m=riserun=ΔyΔx\text{slope}=m=\frac{\text{rise}}{\text{run}}=\frac{\Delta y}{\Delta x}

Next, pick a point and plot it.

The point (5,-2).

Made using Desmos

Then, use the fact that slope is rise over run, to find another point on the line. Basically, find the slope. If our slope is 32\frac32, then the rate of change is: 3 rise2 run\frac{3\text{ rise}}{2\text{ run}}.

Using rise over run, our second point is (7,1).

Made using Desmos

Finally, we draw the line through these points.

Line y + 2 = 3/2(x - 5).

Made using Desmos

To take this a step further, you may be given a word problem of a linear relationship to graph. Follow these steps to solve those problems, too!

Video · + 1 min read

(Video) Graphing a Line Using a Point and Slope

by PatrickJMT

This video by Patrick JMT explains how to graph a line using just a single point and the slope of the line.

Summary\large{\text{Summary}}

To graph an equation in point slope form, the first step is to extract the known point and slope from the equation.

The equation is: y−y1=m(x−x1)y-y_1=m(x-x_1) The slope will be mm and the known point will be the coordinate (x1,y1)(x_1,y_1).

Once you have the point, plot it, and use the slope to find which way the line extends.

Example

Graph the line y−2=3(x−1)y-2=3(x-1).

From the equation we know the slope is m=3m=3 and the line passes through the point (1,2)(1,2).

Next, we plot our point.

The point (1,2).

Made using Desmos

Then use the slope to find which way the line extends. Remember that slope is riserun\frac{\text{rise}}{\text{run}}. So our slope is 3 rise1 run\frac{3\text{ rise}}{1\text{ run}}.

A rise of 3 and a run of 1 from the point (1,2).

Made using Desmos

This gives us another point on our line. All we have to do is connect these points to graph the line.

Line y - 2 = 3(x - 1).

Made using Desmos

Practice 1

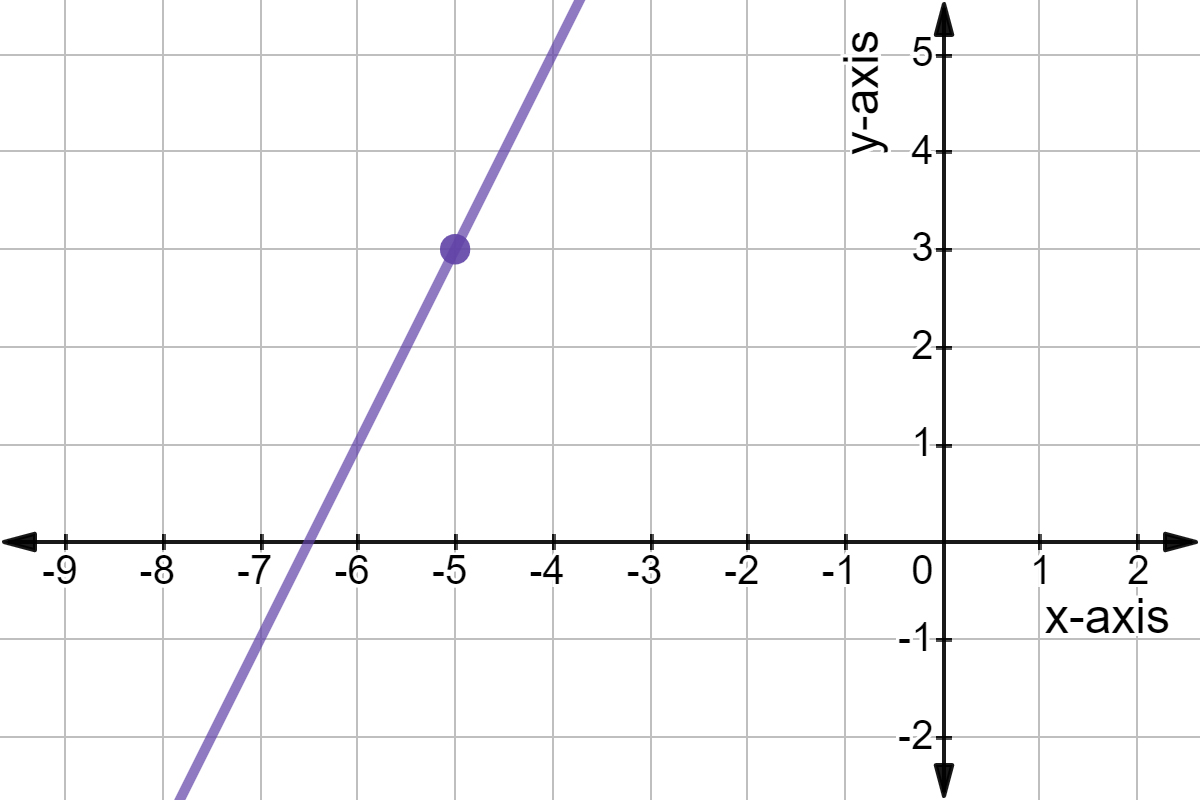
What is the slope of the line? y−3=2(x+5)y-3=2(x+5)

Choose one answer

Illustrated · 1 min

Sketch a Graph Using Point Slope Form

Now that we've learned what point-slope form is, we can learn how to graph it!

Sketch a Graph Using Point Slope Form
1) Evaluate the equation.
$y-2=3(x-1)$
$m=3$
$(x_1, y_1) = (1,2)$
2) Plot the coordinate point
Graph with point $(1,2)$.
3) Use the slope to plot a second point
graph with point $(1,2)$ and two other points.
4) Plot the line!
Previous graph with purple line going through all points.

Image source: by Anusha Rahman

Now you know how to graph a function that is given in point-slope form!

Type a concept, like “slope” or “photosynthesis”.

↑ ↓ to choose · Enter to openSearch explanations and problems